Thresholding in OpenCV
Boost Your Career with Our Placement-ready Courses – ENroll Now
In this article, we’ll be understanding the thresholding techniques provided by the OpenCV library. Thresholding is an image segmentation process, where a function is applied to the pixels of an image to make images easier to analyze. The pixels of the image are assigned a value in relation to the threshold function provided.
Thresholding is the way of selecting areas of interest of an image while ignoring the parts we are not concerned with. It is most commonly used for background and foreground separation.
We’ll also understand how to add a border around an image using the built-in function, copyMakeBorder() provided by the OpenCV library.
Simple Thresholding in OpenCV
Simple thresholding is often referred to as global threshold as the thresholding function is applied equally to every pixel of the image, and the threshold value is fixed. The same threshold value is used for each pixel value. If the pixel value is less than the threshold value, it is updated to 0, otherwise, it is updated to the maximum value.
In OpenCV, cv2.threshold() is used for simple thresholding.
The types of simple thresholding are:
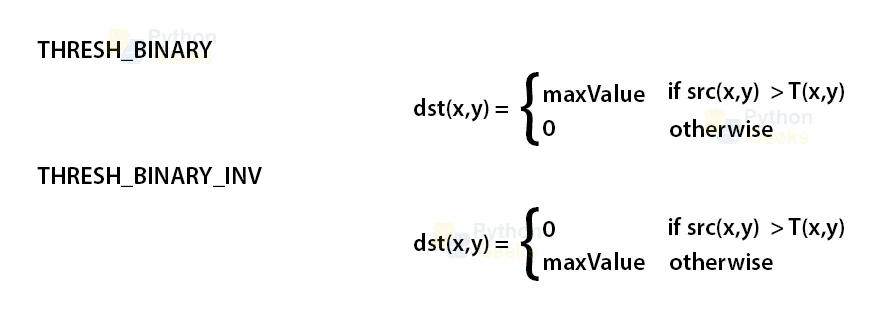
- cv.THRESH_BINARY
- cv.THRESH_BINARY_INV
- cv.THRESH_TRUNC
- cv.THRESH_TOZERO
- cv.THRESH_TOZERO_INV
Syntax
cv2.threshold(src, thresh, maxVal, type)
Parameters
- src: The first argument of the threshold function is the source image, which first has to be converted to grayscale color space.
- thresh: The second argument is the threshold value according to which the pixel values will be set.
- maxVal: The third argument is the maximum value that pixels exceeding the threshold value can take.
- type: The fourth parameter of the function allows us to choose the type of thresholding.
- Return Value: The method returns two values. Threshold function that was used and the thresholded image.
Implementation
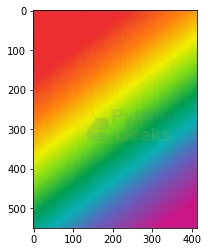
# Importing OpenCV
import cv2

# Importing numpy
import numpy as np

# Importing matplotlib.pyplot
import matplotlib.pyplot as plt

# Reading the image
img = cv2.imread(r'C:\Users\tushi\Downloads\PythonGeeks\rainbow.jpg')
img = cv2.cvtColor(img, cv2.COLOR_BGR2RGB)

# Displaying the image
plt.imshow(img)
# Converting image to grayscale color space
img = cv2.cvtColor(img, cv2.COLOR_RGB2GRAY)
# Applying thresholds and storing the returned values in two variables
ret,thresh1 = cv2.threshold(img,127,255,cv2.THRESH_BINARY)
ret,thresh2 = cv2.threshold(img,127,255,cv2.THRESH_BINARY_INV)
ret,thresh3 = cv2.threshold(img,127,255,cv2.THRESH_TRUNC)
ret,thresh4 = cv2.threshold(img,127,255,cv2.THRESH_TOZERO)
ret,thresh5 = cv2.threshold(img,127,255,cv2.THRESH_TOZERO_INV)
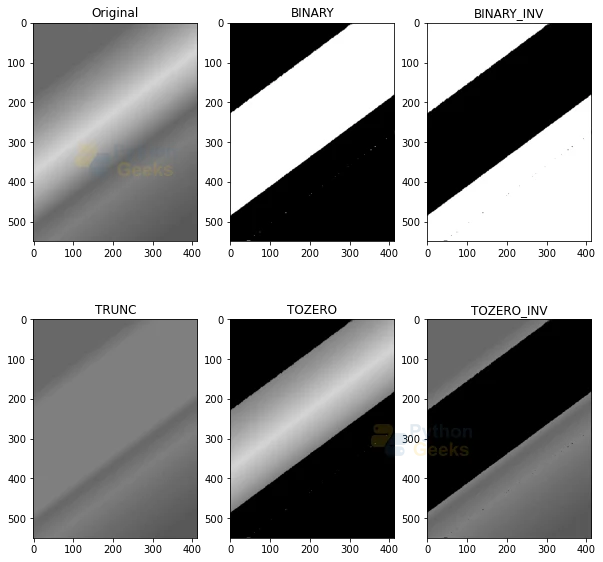
# Plotting the images using matplotlib
titles = ['Original','BINARY','BINARY_INV','TRUNC','TOZERO','TOZERO_INV']
thresholding = [img, thresh1, thresh2, thresh3, thresh4, thresh5]
# Specifying the grid size
plt.figure(figsize=(10,10))
# The number of images in the grid 2*3 = 6
for i in range(6):
plt.subplot(2,3,i+1),plt.imshow(thresholding[i],'gray',vmin=0,vmax=255)
plt.title(titles[i])
# Displaying the grid
plt.show()
Adaptive thresholding in OpenCV
Adaptive thresholding is also often called dynamic or local thresholding technique. It is applied for the cases where the lighting conditions are different in different regions of the image and the threshold value is calculated for smaller regions.
The threshold value for a pixel is determined on the basis of the region around it. Different threshold values are obtained for the different regions of the same image. Adaptive thresholding at pixel level yields superior results as compared to global thresholding, particularly in cases where the image has regions of varying levels of contrasts.
In OpenCV, cv2.adaptiveThreshold() is used for adaptive thresholding.
The types of adaptive thresholding are:
1. cv2.ADAPTIVE_THRESH_MEAN_C: Where threshold value = (Mean of the neighboring values – constant. It is the mean of the block size of a pixel neighborhood subtracted by the constant value.
2. cv2.ADAPTIVE_THRESH_GAUSSIAN_C: Where threshold Value = Gaussian-weighted sum of the neighboring values – constant. It is a weighted sum of the block size of a pixel neighborhood subtracted by a constant value.
Syntax
cv2.adaptiveThreshold(src, maxVal, adaptiveMethod, thresholdType, blockSize, C)
Parameters
- src: The source image, which first has to be converted to grayscale color space.
- maxVal: The maximum value that pixels exceeding the threshold value can take.
- adaptiveMethod: Type of adaptive thresholding method to be used
- thresholdType: Type of adaptive thresholding to be applied.
- blockSize: Size of a neighborhood of the pixel used to calculate the threshold value.
- constant: A constant value that is subtracted from the mean or weighted mean.
Implementation
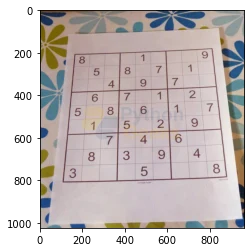
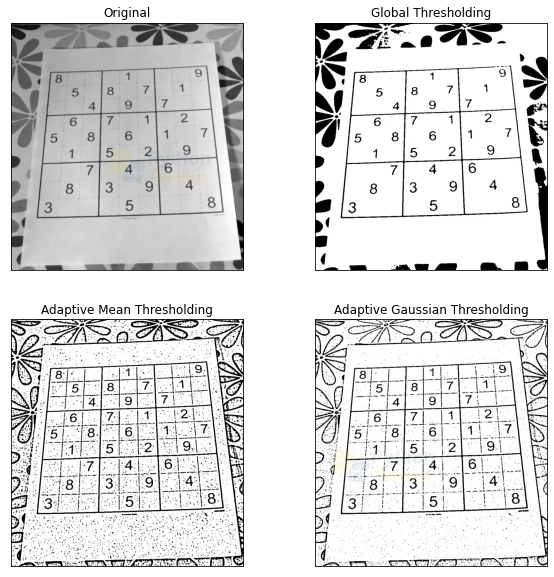
# Importing OpenCV
import cv2

# Importing numpy
import numpy as np

# Importing matplotlib.pyplot
import matplotlib.pyplot as plt

# Reading the image
img = cv2.imread(r'C:\Users\tushi\Downloads\PythonGeeks\suduko.jpg')
img = cv2.cvtColor(img, cv2.COLOR_BGR2RGB)

# Displaying the image
plt.imshow(img)
# Converting to grayscale color space and applying median blur
img = cv2.cvtColor(img, cv2.COLOR_RGB2GRAY)
img = cv2.medianBlur(img,5)

# Global thresholding
ret,th1 = cv2.threshold(img,127,255,cv2.THRESH_BINARY)

# Adaptive thresholding
th2 = cv2.adaptiveThreshold(img,255,cv2.ADAPTIVE_THRESH_MEAN_C,            cv2.THRESH_BINARY,11,2)
th3 = cv2.adaptiveThreshold(img,255,cv2.ADAPTIVE_THRESH_GAUSSIAN_C,            cv2.THRESH_BINARY,11,2)

# Plotting the images using matplotlib
titles = ['Original', 'Global Thresholding',
            'Adaptive Mean Thresholding', 'Adaptive Gaussian Thresholding']
images = [img, th1, th2, th3]

# Specifying the grid size
plt.figure(figsize=(10,10))

# Number of images in the grid 2*2 = 4
for i in range(4):
    plt.subplot(2,2,i+1),plt.imshow(images[i],'gray')
    plt.title(titles[i])
    plt.xticks([]),plt.yticks([])

# Displaying the grid
plt.show()
Otsu’s binarization in OpenCV
An arbitrary value is set as the threshold in the global thresholding method. In Otsu’s binarization, we avoid choosing a predetermined threshold value and the function sets the value automatically. Otsu’s binarization comes under adaptive thresholding as a way of image binarization in image processing.
The function finds the optimal threshold value of the input image by going through all values possible as the threshold value.
When we have an image with only two distinct image values, where two dominant modes characterize the image histogram and it would consist of only two peaks, the image histogram is referred to as bimodal histogram. The single threshold value is sufficient for image partitioning and hence Otsu’s binarization is used.
Otsu’s method determines an optimal threshold value from the image histogram. Otsu’s method is used to find a suitable threshold value that will minimize the weighted within-class variance. Weighted within-class variance is defined as the sum of the variances for the two classes.
The Otsu’s Binarization is implemented in OpenCV using the cv.threshold() function, where the flag is set to cv.THRESH_OTSU.
Syntax
cv2.threshold(src, thresh, maxVal, type)
Parameters
- source: Source image or input image
- thresh: Threshold value
- maxVal: Maximum value assigned to a pixel
- type: The type of thresholding
Implementation
# Importing OpenCV
import cv2

# Importing matplotlib.pyplot
import matplotlib.pyplot as plt

# Reading the image and converting to grayscale
img = cv2.imread(r'C:\Users\tushi\Downloads\PythonGeeks\suduko.jpg')
img = cv2.cvtColor(img, cv2.COLOR_BGR2GRAY)

# Applying the Otsu's binarization
ret, otsu_image = cv2.threshold(img,0,255,cv2.THRESH_OTSU)

# Plotting the images using matplotlib
titles = ['Original', 'Otsu Binarization']
images = [img, otsu_image]

# Specifying the grid size
plt.figure(figsize=(10,10))

# Number of images in the grid 2*1 = 2
for i in range(2):
plt.subplot(1,2,i+1),plt.imshow(images[i],'gray')
plt.title(titles[i])
plt.xticks([]),plt.yticks([])

# Displaying the grid
plt.show()
Adding Borders using copyMakeBorder() in OpenCV
The copyMakeBorder function is used to create a border around an image in OpenCV.
The function copies the source image into the middle of the destination image. The areas to the left, to the right, above, and below the copied source image will be filled with extrapolated pixels.
The following types of border options are available in OpenCV:
1. Constant value border: Applies padding of a constant value for the whole border. It adds a colored border
2. Reflected border: It reflects the border elements
3. Replicated border: The border will be replicated from the pixel values at the edges of the original image.
Syntax
cv2.copyMakeBorder(src, top, bottom, left, right, borderType, dst, value)
Parameters
- src: Source image around which borders will be drawn.
- dst: Output image.
- top, bottom, left, right: All values are the number of pixels in the corresponding direction.
- borderType: The type of border.
- value: Border value (helps in color). It is optional.
Implementation
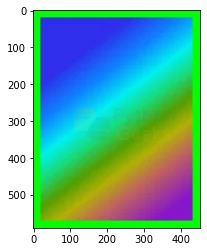
# Importing OpenCV
import cv2

# Reading the image
img = cv2.imread(r'C:\Users\tushi\Downloads\PythonGeeks\rainbow.jpg')

# Applying border around the image
border1 = cv2.copyMakeBorder(img,20,20,20,20,cv2.BORDER_CONSTANT,value=(0,255,0))
plt.imshow(border1)
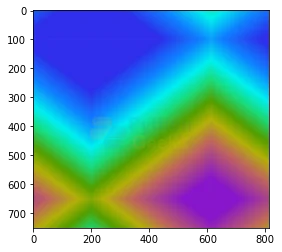
# Applying border around the image
border2 = cv2.copyMakeBorder(img,100,100,200,200,cv2.BORDER_REFLECT)
plt.imshow(border2)
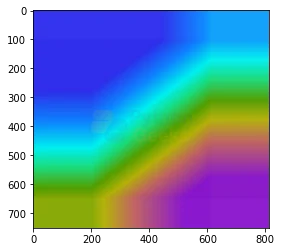
# Applying border around the image
border3 = cv2.copyMakeBorder(img,100,100,200,200,cv2.BORDER_REPLICATE)
plt.imshow(border3)
Conclusion
Through this article, we understood the thresholding methods provided by the OpenCV library. We learned about global and adaptive thresholding and their types. Furthermore, we learned how to apply binarization to an image using Otsu’s Binarization thresholding method. We also learned the various ways to add borders around a picture using the built-in functions provided by OpenCV.
