7 Regression Techniques in Artificial Intelligence
Boost Your Career with Our Placement-ready Courses – ENroll Now
Have you ever wondered how finance managers value their assets? Or pondered how to predict the sales volume for the current long term?
If so, you’ve come to the correct place.
The answer to your question is two words. “Regression Analysis”
But what exactly is Regression Analysis?
What is Regression Analysis?
Regression analysis is a predictive modeling approach that examines the relationship in a dataset between the dependent variable(target) and the independent variable(predictors).
It makes it simple to determine the strength of the relationship between these two categories of variables in order to model future relationships between them. Regression analysis describes changes in the target’s behavior in response to changes in a few predictors.
In Artificial Intelligence, regression analysis is the most common technique for resolving regression problems using data modeling. It involves determining the best fit line, which passes through all of the data points with the shortest distance between them.
But how do you decide which technique of Regression might suit you better? Especially when the target and independent variables have a linear or non-linear connection.
Well, let’s dig deeper to get our answer!
Types of Regression Techniques
There are six different types of regression techniques, and the number of components determines which one to employ. The type of target variable, the form of the regression line, and the number of independent variables are all considerations to consider.
The following are the seven regression techniques:
- Linear Regression
- Logistic Regression
- Ridge Regression
- Lasso Regression
- Polynomial Regression
- Stepwise Regression
- ElasticNet Regression
1. Linear Regression
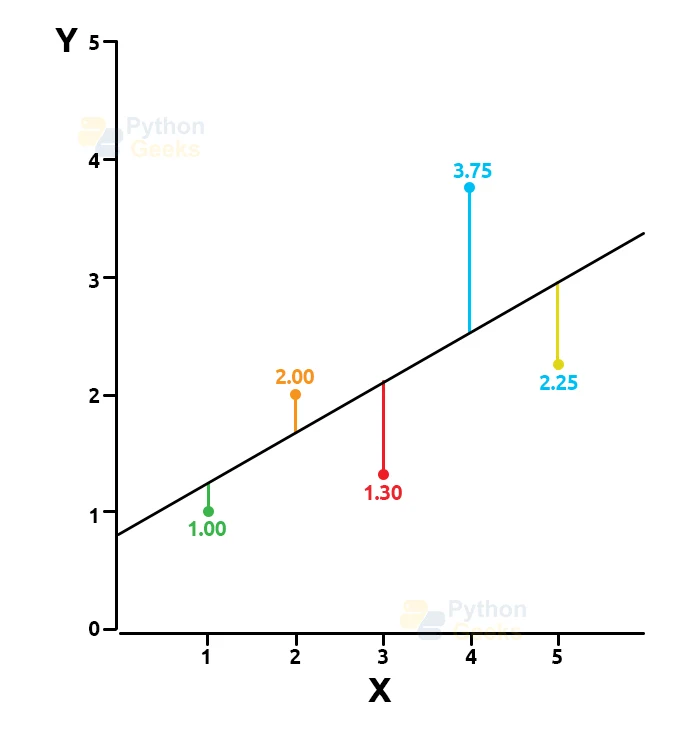
Being one of the most basic types of regression analysis, Linear Regression defines a linear relationship between the dependent and independent variables. A best fit straight line also called a regression line, is used in linear regression to demonstrate a link between these two variables.
Y=a+b*X + e is a linear regression equation in which a represents the intercept, e represents the error term in the model, and b represents the line’s slope.
2. Logistic Regression
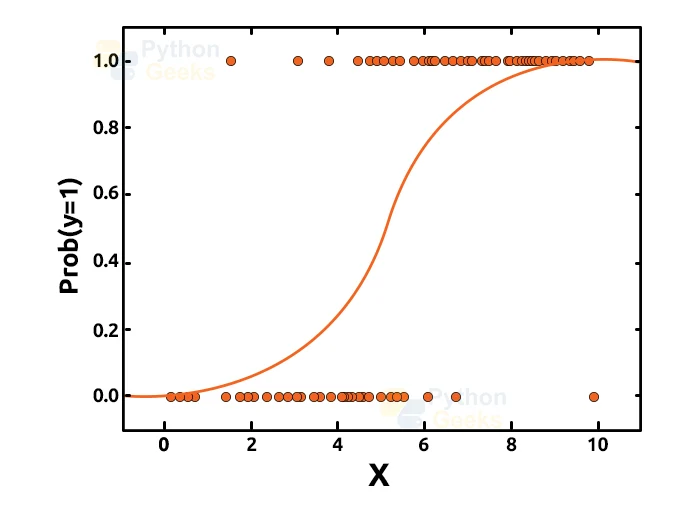
The nature of the dependant variable in logistic regression is that it is binary. It’s a type of binomial regression that calculates logistic model parameters. Using logistic regression, data with two possible criteria are dealt with. It’s used to calculate the chances of an event=Success and an event=Failure happening. When the dependent variable is binary in nature (0/1, True/ False, Yes/ No), we should utilize logistic regression.
The logistic regression is represented by the equation below:
logit(p) = ln(p/(1-p)) = b0+b1X1+b2X2+b3X3….+bkXk
where p is the feature’s probability of occurrence.
3. Ridge Regression
Ridge Regression is a technique for dealing with multicollinear data with highly correlated independent variables. Even though the least-squares estimates (OLS) are unbiased in multicollinearity, their variances are substantial, causing the observed value to diverge significantly from the true value. By introducing a degree of bias to the regression estimates, ridge regression minimizes standard errors.
As a result, a bias matrix is included in the Ridge Regression equation.
The Ridge Regression is denoted by the equation below, where the addition of (lambda) overcomes the problem of multicollinearity:
β = (X^{T}X + λ*I)^{-1}X^{T}y
The Ridge Regression has a significant property where it shrinks the value of coefficients but does not approach zero, implying that there is no feature selection feature.
4. Lasso Regression
The word “LASSO” is the abbreviation for “Least Absolute Shrinkage and Selection Operator.” It’s a statistical formula for regularising data models and selecting features.
Regularization is a significant principle for avoiding data overfitting, especially when the trained and test data differ significantly. Only the needed features are employed in Lasso Regression, while the remaining ones are set to zero to prevent data overfitting. This model is famous for its shrinkage method where data values are shrunk towards a central point as the mean.
Lasso Regression employs the L1 regularisation technique, which imposes a penalty equal to the absolute value of the coefficient’s magnitude. This type might lead to models with few coefficients that are sparse. Some coefficients may become 0, and get discarded. The larger the penalty, the closer the coefficient value is to zero ((Perfect for making simpler models)
The mathematical equation for this is:
Residual sum of Squares + λ * (Sum of the absolute value of the magnitude of coefficients)
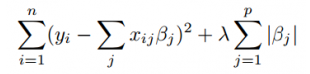
where λ denotes the amount of shrinkage
5. Polynomial Regression
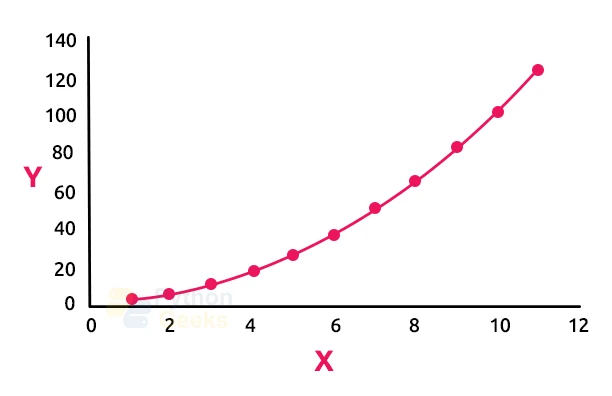
The power of the independent variable in a polynomial regression is greater than 1. This model is used when the connection between the dependent and independent variables, X and Y, is non-linear, as shown by the n-th degree.
Instead of a straight line, the best fit line in polynomial regression is a curve that depends on the power of X or the value of n. Because it is prone to overfitting, it is best to study the curve near the end, as the higher polynomials can produce unusual extrapolation findings.
The equation for Polynomial Regression is:
l = β0+ β0x1+ε
6. Stepwise Regression
When dealing with several independent variables, this type of regression is used. The selection of independent variables is done with the help of an automatic method that does not require human interaction in this technique.
To accomplish this feat, statistical parameters like R-square, t-stats and the AIC metric are used to identify significant factors. Stepwise regression is a method of fitting a regression model by adding or removing co-variates one at a time, according to a set of criteria. The following are some of the most often used Stepwise regression methods:
- Forward selection begins with the model’s most important predictor and adds a variable at each step.
- Backward elimination begins with all predictors in the model and progresses through each phase, removing the least significant variable.
This modeling technique aims to maximize prediction power while using the fewest number of predictor variables possible. It is one of the methods for dealing with data sets with higher dimensionality.
7. ElasticNet Regression
ElasticNet is a technique that combines Lasso with Ridge Regression. As a regularizer, it is trained with L1 and L2. Elastic-net is useful when there are several connected features. Lasso is more likely to choose one at random, but elastic-net is more likely to choose both.
![]()
Trading-off between Lasso and Ridge has the practical advantage of allowing Elastic-Net to inherit some of Ridge’s rotational stability.
Program
# importing libraries
import numpy as np
import matplotlib.pyplot as plt
from sklearn.linear_model import LinearRegression
x = 11 * np.random.random((10, 1))
# y = a * x + b
y = 1.0 * x + 3.0
# create a linear regression model
model = LinearRegression()
model.fit(x, y)
# predict y from the data where the x is predicted from the x
x_pred = np.linspace(0, 11, 100)
y_pred = model.predict(x_pred[:, np.newaxis])
# plot the results
plt.figure(figsize =(3, 5))
ax = plt.axes()
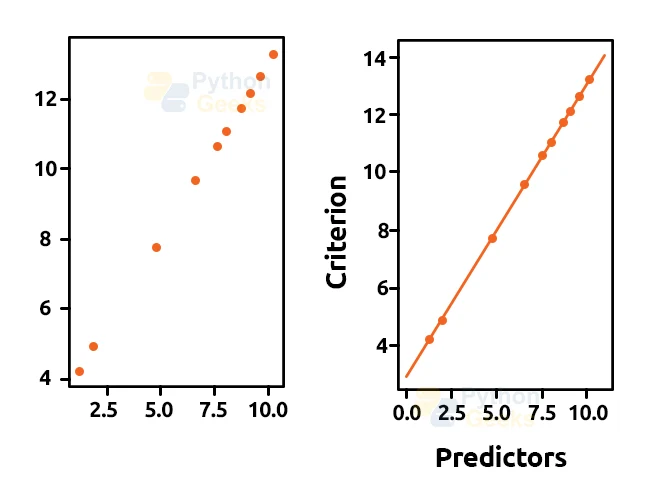
ax.scatter(x, y)
ax.plot(x_pred, y_pred)
ax.set_xlabel('predictors')
ax.set_ylabel('criterion')
ax.axis('tight')
plt.show()
Output
How do you choose the best regression model?
When you simply know one or two techniques, life is usually simple. If the outcome is continuous, one of the training institutes I know encourages their students to use linear regression. Use logistic regression if the data is binary! However, the greater the number of possibilities available to us, the more difficult it is to select the best one. Regression models are in a similar situation.
Within the various forms of regression models, it is critical to select the most appropriate technique depending on the type of independent and dependent variables, data dimensionality, and other significant data features.
The following are the essential factors to consider while choosing a regression model:
1. Exploration of data is an unavoidable element of developing a prediction model. Identifying the link and influence of variables should be your first step before choosing the proper model.
2. We can use metrics like the statistical significance of parameters, R-square, Adjusted r-square, AIC, BIC, and error term to compare the goodness of fit of different models. Mallow’s Cp criteria is another. This simply examines your model for possible bias by comparing it to all possible submodels (or a careful selection of them).
3. Cross-validation is the most effective method for evaluating prediction models. In this step, you’ll separate your data into two groups (train and validate). The prediction accuracy can be measured using a simple mean squared difference between observed and anticipated values.
4. You should not utilize the automatic model selection approach if your data set contains numerous confounding factors because you do not want to include them all in a model at the same time.
5. It will also be determined by your goal. It’s possible that a less powerful model is easier to implement than one with a high statistical significance.
6. In cases of high dimensionality and multicollinearity among the variables in the data set, regression regularisation approaches (Lasso, Ridge, and ElasticNet) function effectively.
Conclusion
There are numerous other types of regression techniques in Artificial Intelligence besides the ones listed above, such as Bayesian Linear Regression, and Ecological Regression, among others.
Therefore, it is critical to select the most appropriate technique based on the type of independent and dependent variables, data dimensionality, and other significant data features.
