Python Debugger Module
Get ready to crack interviews of top MNCs with Placement-ready courses Learn More!
When we write a program, it is not true that the code always runs without any error. The process we use to handle the errors is called debugging. In this article, we will be learning about the module named Python Debugger, in short pdb, that Python provides for debugging purposes. We will be discussing the implementation, commands, and also functions in the module.
Let us start with the introduction to this module.
Python Debugger Module
The Python Debugger module is the standard module in Python for debugging the programs. It facilitates interactive debugging of the code. It is actually defined in a class named Pdb which uses the bdb(basic debugger functions) and cmd modules. This module also supports command line interfacing. Some other benefits it gives are:
1. Setting conditional breakpoints
2. Stepping through the lines of code
3. Source code listing
4. Inspection of stack traces
5. Post mortem debugging
Debugging using PDB
To debug using pdb we first need to import the module using the below command.
import pdb
Then we insert the set_trace() function which stops the execution and hard codes a breakpoint in the code. Let us see an example for further understanding.
Example of debugging using pdb:
import pdb
def prod(a, b):
  res = a * b
  return res
pdb.set_trace()
n1 = int(input("Enter the first number : "))
n1 = int(input("Enter the second number : "))
result = prod(n1,n2)
print(result)
In the code, we are
1. Importing the pdb module
2. Created a function named prod to return the product of inputs
3. Called the set_trace() method
4. Taking input of two numbers
5. Calling the prod function by passing the inputs
6. Printing the result
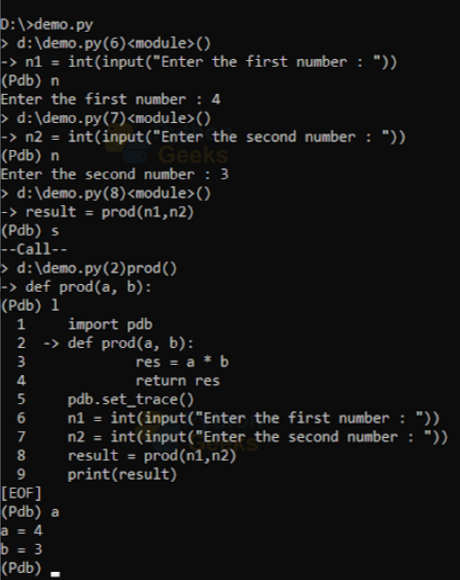
Now let us save this file as ‘demo.py’ and run it on the command prompt. We get the following output.

In this, we first changed our directory to the location where the python file exists. Then we ran the code in that file by giving the file name as the command. We can observe that on the first line after the angle bracket, we have the directory path of our file, the line number where our breakpoint is located, and the word <module>. This line shows that a breakpoint exists in the file demo.py on the 6th line and it is a module-level so the named module inside <>.
The next line shows the line of the code where the execution is stopped. This line is not executed yet. After this, we have the pdb prompt.
Before navigating through the code, let us see some of the commands we use in the command prompt:
1. l: This command is used to list out the code and point an arrow to the line where the execution stopped
2. n[ext]: This command is used to execute the current pointing line and move the pointer to the next line.
3. where: This is used to find the line number at which the current execution stopped.
Now let us go back to the command prompt. Let us see what happens if we give the first command as ‘l’.
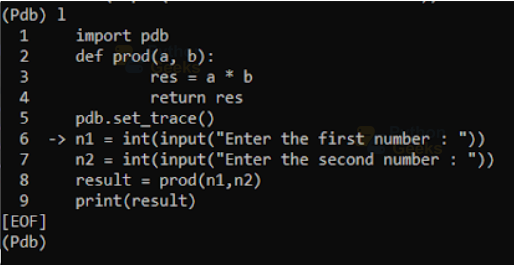
We can see that the whole code is shown and an arrow points to the 6th line, where the execution stopped.
Now let us execute this line using the ‘n’ command.
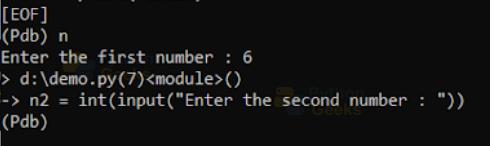
On giving the ‘n’ as the command, it asked for a number to be entered. This shows that line 6 got executed. To confirm this, let us see the line number using the ‘where’ command as shown below.

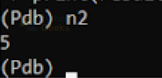
Now let us execute further using the ‘n’ command to get the output.

We can see that we got the expected result and that is 30. We can also get information about any variable also using pdb. Let us get the value of n2.
Python PDB Commands
We saw some of the commands above. Let us see some of them.
1. h[elp]:
This function is used to get information about all the available debugging commands. This is shown in the below code.

2. d(own) [count]:
This command moves the current frame count down by the specified number of levels, in the stack trace, to a newer frame. If no count is mentioned, the default is 1.
3. u(p) [count]:
This command moves the current frame count up by the specified number of levels, in the stack trace, to a newer frame. By default, the count is 1.
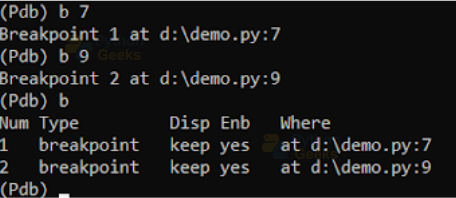
4. b(reak) [([filename:]lineno | function) [, condition]]:
This function gives all the breakpoints in the code. If the lineno argument is given, then it adds a breakpoint in the specified line. In addition, if the function is given, then it adds a breakpoint to the first line of the function.
Let us add some breakpoints to the above code and see some breakpoints.
5. tb(reak) [([filename:]lineno | function) [, condition]]:
The tbreak refers to a temporary break. When we first hit enter on that line, it gets removed.
6. cl(ear)[filename:lineno | bpnumber [bpnumber …]]:
This command is used to clear all the breakpoints.
7. disable [bpnumber [bpnumber …]]:
This command is used to disable the breakpoints specified in the list of breakpoint numbers. A disabled breakpoint stays in the list of breakpoints and we can re-enable it when we want.
Remember we gave two breakpoints previously. Let us see what happens when we disable one of them.
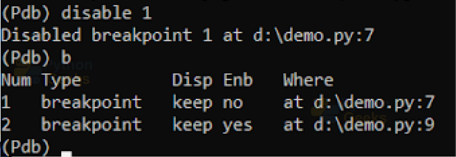
We can see that on disabling the 1st breakpoint when we give the ‘b’ command we got both the breakpoints. But the first one gives the enable as no.
8. enable [bpnumber [bpnumber …]]:
This is used to enable the disabled breakpoint. Let us now enable the first breakpoint and see the breakpoints again.
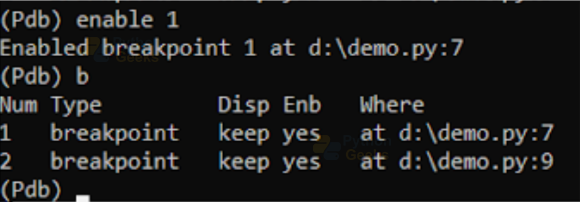
As expected we got both the breakpoints as enabled.
9. ignore bpnumber [count]:
This command ignores the count number of the specified breakpoint. The default value is 0 and for this value the breakpoint becomes active.
Otherwise, the count decrements every time the prompt reaches the specified breakpoint, if it’s enabled and the associated condition is true.
Let us give a command to the 2nd breakpoint.

10. condition bpnumber [condition]:
This command sets a condition for the specified breakpoint. This may be an expression that gives a boolean True.
It is an optional argument. So, if we don’t provide any condition, it makes the breakpoint unconditional and also removes any existing condition.
11. commands [bpnumber]:
This specifies a list of commands for the specified breakpoint.
12. s(tep):
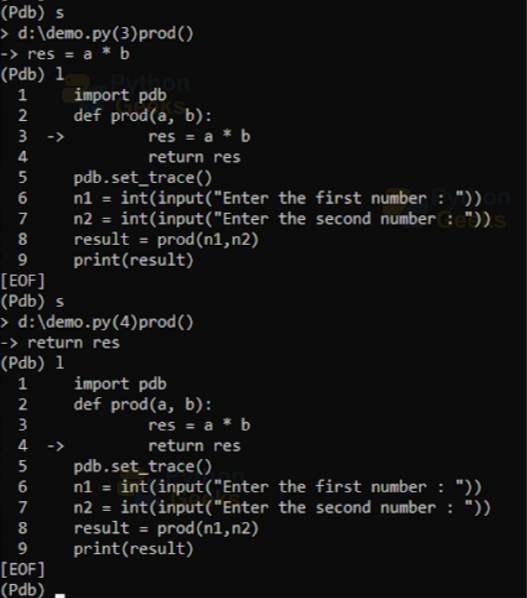
This function moves the pointer to the function call at the current line. Let us see the below code for further understanding.

We can see that when the current line is a function call and if we give the command as ‘s’. Then the pointer goes to the function definition, rather than going to the next line in the code.
Now if we command ‘s’ again, the pointer goes to the next line in the function.
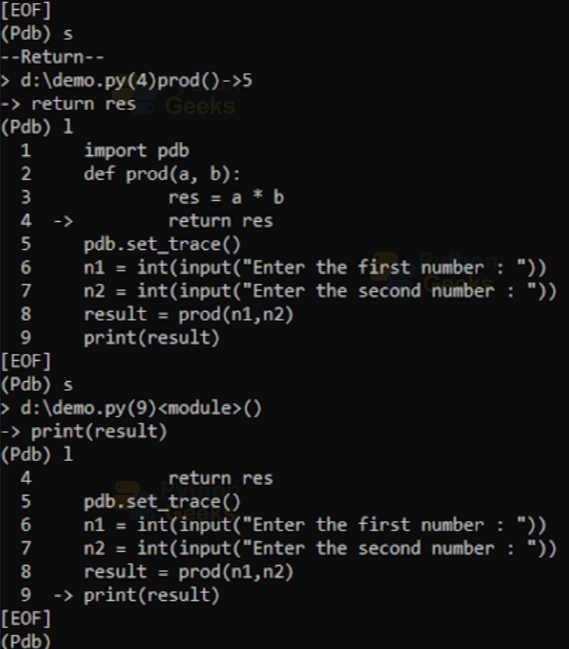
We are at the end of the function. Now if we call again ‘s’, then the pointer stays at the last line. Again if we give ‘s’, it goes out of the function and points to the line where it stopped execution outside the function.
13. unt(il) [lineno]:
On running this command without any argument, the execution continues until it reaches a line with a number greater than the current.
If we give the line number, the execution continues until it reaches a line with a number equal to or greater than the specified one.
14. r(eturn) :
This command continues the execution until the current function returns a value.
15. c(ont(inue));
This command continues the execution till it reaches the breakpoint.
16. j(ump) lineno
This command jumps to the specified line number. This is available only in the bottom-most frame, so the jump can be made back to execute code again.
17. ll | longlist
This gives the source code for the current frame or function.
18. a(rgs)
This command prints the arguments in the current function. Let us see the arguments in the prod function by going to the line where the function definition is present and then using the ‘s’ command.
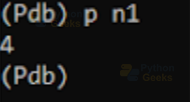
19. p expression & pp expression:
This command prints the value of an expression. Let us print the value of n1 that we get on giving the above inputs.
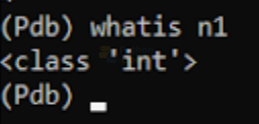
20. what is expression:
This command is used to get the data type of the specified expression.
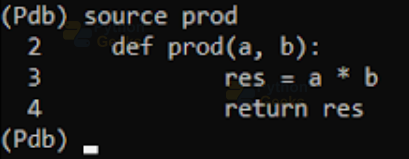
21. source expression:
This command returns the source code of the specified expression or object. Let us get the source code of the prod function.
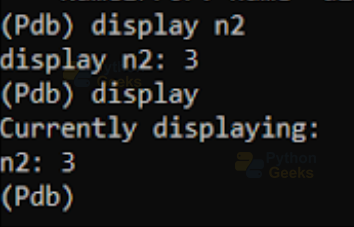
22. Display [expression]:
This command shows the value of the expression if it is changed. Let us see the below command.
23. undisplay [expression]:
This command doesn’t display the specified expression in the current frame
24. Interact
This command starts an interactive interpreter with all the current scope names in its global namespace.

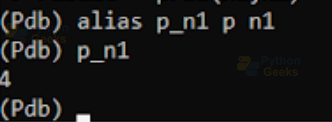
25. alias [name [command]]
This command creates an alias name for the executable command. For example, let us execute the command to print n1 by giving it an alias name p_n1.
26. unalias name:
This removes the alias name.
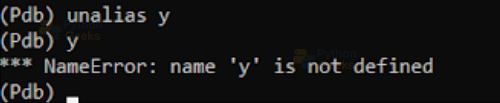
We can see that after unaliasing ‘y’, we are not able to access it.
27. !statement:
This command executes a single line statement in the context of the current stack frame.
28. restart [args …]
This command restarts the debugged Python code.
29. q(uit)
This quits from the Python debugger.
Python PDB Functions
Previously we have seen the function set_trace(). There are some other functions that the PDB module proves. Let us see them.
1. run(statement, globals=None, locals=None):
This function is used to execute the statement under the debugger’s control.
2. runeval(expression, globals=None, locals=None)
This function evaluates the expression under the debugger’s control.
3. runcall(function, *args, **kwds)
This function calls the specified function in the arguments.
4. set_trace()
This function lets us enter the debugger at the calling stack frame.
5. post_mortem(traceback=None)
This function lets do post-mortem debugging of the specified traceback object. In this debugging, the debugger looks for an active trace back and starts the debugging process at the line in the stack where the exception occurred.
6. pm()
This function is similar to the post_mortem() function. It lets us enter the post-mortem debugging of the traceback in the sys.last_traceback.
Quiz on Python Debugger Module
Conclusion
In this article, we learned about the Python debugger module and its commands with examples. We also saw some functions provided by this module.
Hope you could understand the concepts covered. Happy learning!
