Machine Learning Parkinson’s Disease Detection Project
Master Programming with Our Comprehensive Courses Enroll Now!
The objective of this project model is to develop a Random Forest Classifier model that can predict whether an individual has Parkinson’s disease based on various features. In order to improve the model’s performance, hyperparameters are optimised using the GridSearchCV method. The performance of the model is then evaluated by calculating its accuracy, generating a confusion matrix, and creating a classification report.
The ROC curve is plotted, and the AUC score is calculated to assess the model’s performance at different thresholds. The class imbalance issue in the dataset is addressed by balancing the classes using the RandomOverSampler method. By accomplishing these objectives, this project on PythonGeeks Platform aims to develop an accurate and reliable model for detecting Parkinson’s disease based on patient data.
About Dataset
The Parkinson’s dataset is a collection of data related to voice recordings of individuals suffering from Parkinson’s disease. The dataset is taken from an online source and hence requires an internet connection. The dataset contains 24 features that can be used to classify whether a person has Parkinson’s disease or not. The features include measures of vocal fundamental frequency, jitter, and shimmer, among others. The dataset has 195 records, and each record corresponds to a voice recording from a different individual. The dataset is commonly used for machine learning tasks related to Parkinson’s disease diagnosis, and it can be used to develop models to accurately detect Parkinson’s disease in patients.
Prerequisites for Parkinson’s Disease Detection Using Machine Learning
- Pandas
- Seaborn
- Matplotlib
- Scikit-learn
- Imblearn`
Download Machine Learning Parkinson’s Disease Detection Project
Please download the source code of the Machine Learning Parkinson’s Disease Detection Project from the following link: Machine Learning Parkinson’s Disease Detection Project Code
Steps to Develop Detection of Parkinson’s Disease in Machine Learning
Following are the steps for developing the Machine Learning Parkinson Disease Detection Project:
1. Importing the required libraries
import numpy as np
import pandas as pd
import seaborn as sns
import matplotlib.pyplot as plt
from sklearn.model_selection import train_test_split, GridSearchCV
from sklearn.preprocessing import StandardScaler
from sklearn.metrics import confusion_matrix, classification_report, roc_curve, roc_auc_score
from sklearn.ensemble import RandomForestClassifier
from imblearn.over_sampling import RandomOverSampler
This code imports various libraries and modules needed for the pipeline, including NumPy, Pandas, Seaborn, Matplotlib, and scikit-learn (sklearn), which contains the Random Forest Classifier model and other machine learning tools.
2. Reading the dataset
parkinsons_data = pd.read_csv (‘https://archive.ics.uci.edu/ml/machine-learning- databases/parkinsons/parkinsons.data’)
This line reads in the Parkinson’s dataset from a URL and stores it in a Pandas DataFrame called parkinsons_data.
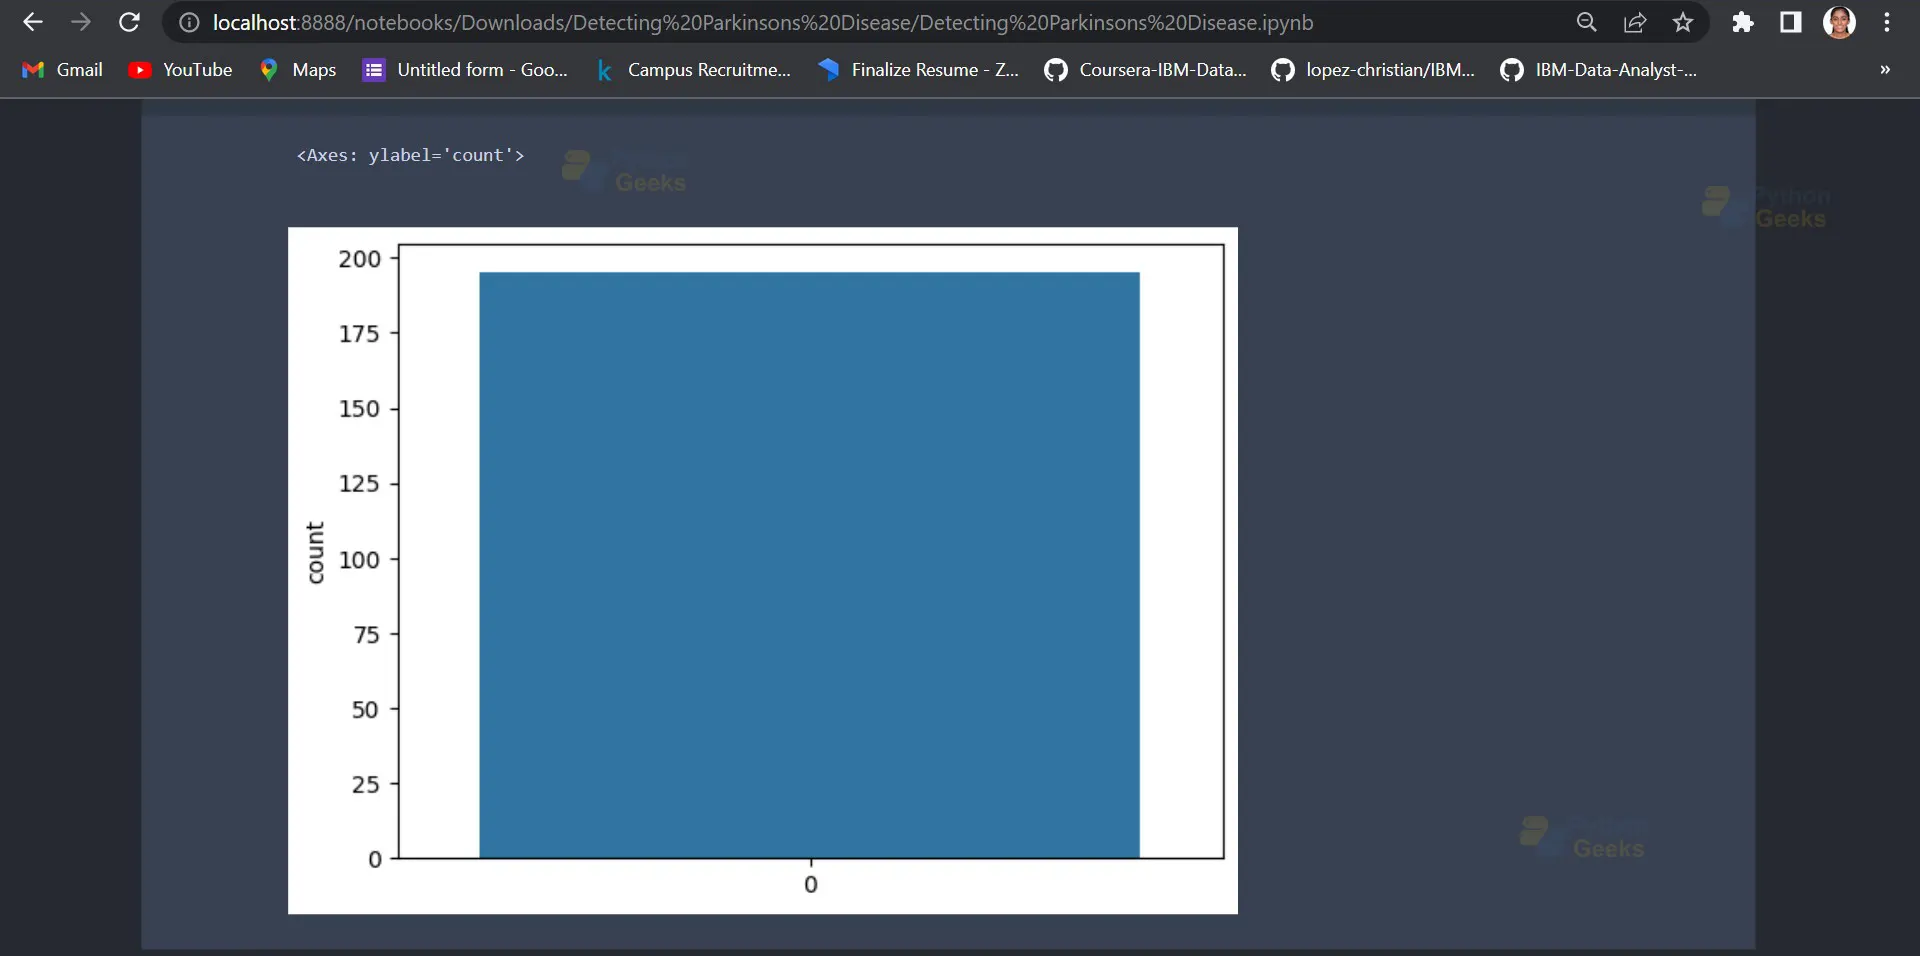
3. Exploratory data analysis
parkinsons_data.status.value_counts()
sns.countplot(parkinsons_data.status)
Output:
4. Splitting the dataset into features and labels
X = parkinsons_data.drop(['name','status'],axis=1)
y = parkinsons_data.status
These lines separate the features and target variables from the DataFrame. X contains all columns except name and status, while y contains only the status column.
5. Oversampling the minority class using RandomOverSampler
ros = RandomOverSampler(random_state=42)
X, y = ros.fit_resample(X, y)
These lines balance the classes of the target variable y using Random Over Sampling from the imbalanced-learn (imblearn) library.
6. Scaling the features using StandardScaler
scaler = StandardScaler()
X = scaler.fit_transform(X)
These lines standardize the features in X using the StandardScaler function from scikit-learn.
7. Splitting the resampled dataset into training and testing sets
X_train, X_test, y_train, y_test = train_test_split(X, y, test_size=0.3, random_state=42)
These lines split the data into training and testing sets using the train_test_split() function from scikit-learn, with a test size of 30%.
8. Creating the logistic regression model
rfc = RandomForestClassifier(random_state=42)
This line creates a Random Forest Classifier model with a random state of 42.
9. Setting up the GridSearchCV to optimize hyperparameters
params = {'n_estimators': [100, 200, 300, 400, 500], 'max_depth': [1, 5, 10, 15, 20]}
grid_search = GridSearchCV(rfc, params, cv=5)
These lines set up a grid search to find the best hyperparameters for the Random Forest Classifier model using the GridSearchCV function from scikit-learn. The grid search will test different values for n_estimators and max_depth, with 5-fold cross-validation.
10. Training the model
grid_search.fit(X_train, y_train)
This line fits the grid search on the training data.
11. Predicting the labels for the testing set
y_pred = grid_search.predict(X_test)
This line uses the predict method of the grid_search object to predict the labels for the testing set, which is stored in X_test. The predicted labels are stored in y_pred.
12. Evaluating the model performance by printing the confusion matrix, classification report, and accuracy score
# Evaluating the model performance
confusion = confusion_matrix(y_test, y_pred)
print("Confusion matrix:\n", confusion)
report = classification_report(y_test, y_pred)
print("Classification report:\n", report)
accuracy = grid_search.score(X_test, y_test)
print(f"Accuracy: {accuracy:.2%}")
Output:

This code block calculates and prints the model’s performance metrics. First, it calculates the confusion matrix between the predicted labels (y_pred) and the true labels (y_test) using the confusion_matrix function from sklearn.metrics module. Then, it prints the confusion matrix using the print statement.
Next, it calculates the classification report using the classification_report function from the sklearn.metrics module, and prints it using the print statement. The classification report provides a summary of precision, recall, and f1-score for each class.
Finally, it calculates the accuracy score of the model on the testing set using the scoring method of the grid_search object, which returns the mean accuracy on the given test data and labels. The accuracy score is printed using the print statement.
The accuracy of the model is 96.63%.
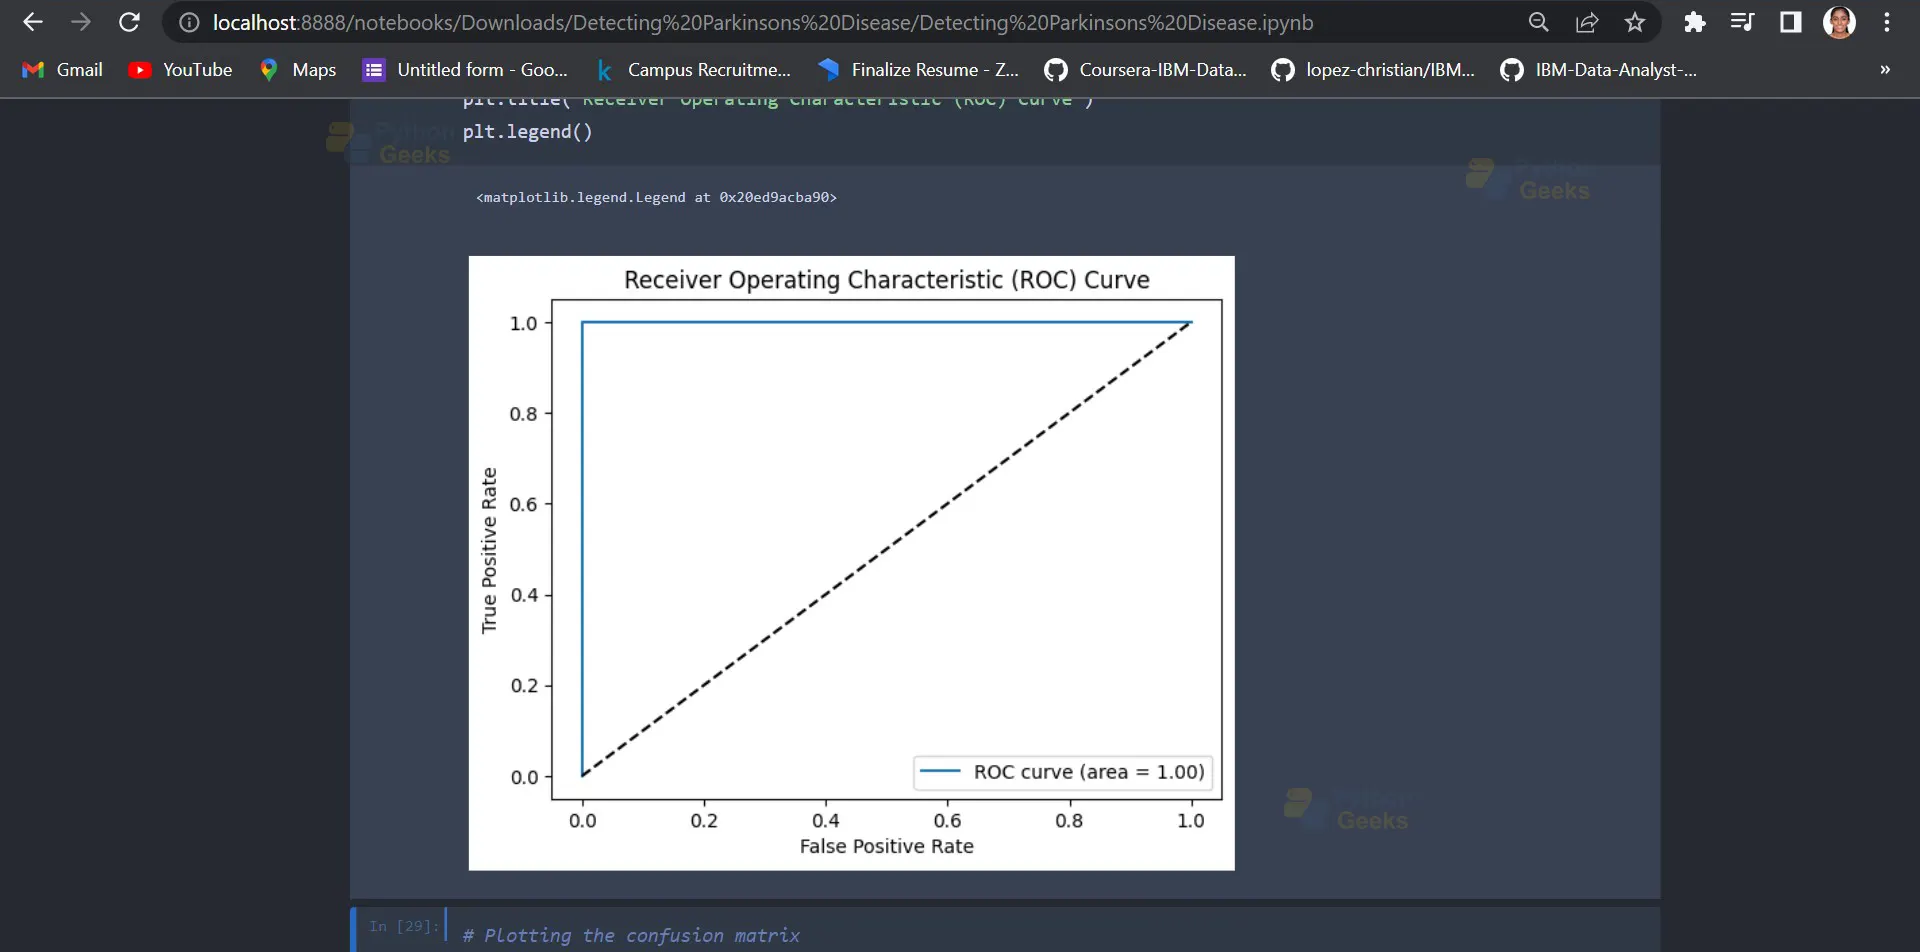
13. Plotting the ROC curve
# Plotting the ROC curve
y_prob = grid_search.predict_proba(X_test)[:,1]
fpr, tpr, thresholds = roc_curve(y_test, y_prob)
auc = roc_auc_score(y_test, y_prob)
plt.plot(fpr, tpr, label=f"ROC curve (area = {auc:.2f})")
plt.plot([0, 1], [0, 1], 'k--')
plt.xlabel('False Positive Rate')
plt.ylabel('True Positive Rate')
plt.title('Receiver Operating Characteristic (ROC) Curve')
plt.legend()
This code block plots the ROC (Receiver Operating Characteristic) curve for the model’s predictions. It first calculates the predicted probabilities of the positive class using the predict_proba method of the grid_search object and selects the second column (index 1) of the resulting array using [:,1].
Then, it calculates the false positive rate, true positive rate, and thresholds for the ROC curve using the roc_curve function from the sklearn.metrics module. It also calculates the AUC (Area Under the Curve) score for the ROC curve using the roc_auc_score function from the same module.
Finally, it plots the ROC curve and the line y=x (for reference) using the plot method of the plt object. It sets the labels for the x and y axes and the title of the plot using xlabel, ylabel, and title methods of the plt object, respectively. It also sets the legend for the plot using the legend method of the plt object.
Output:
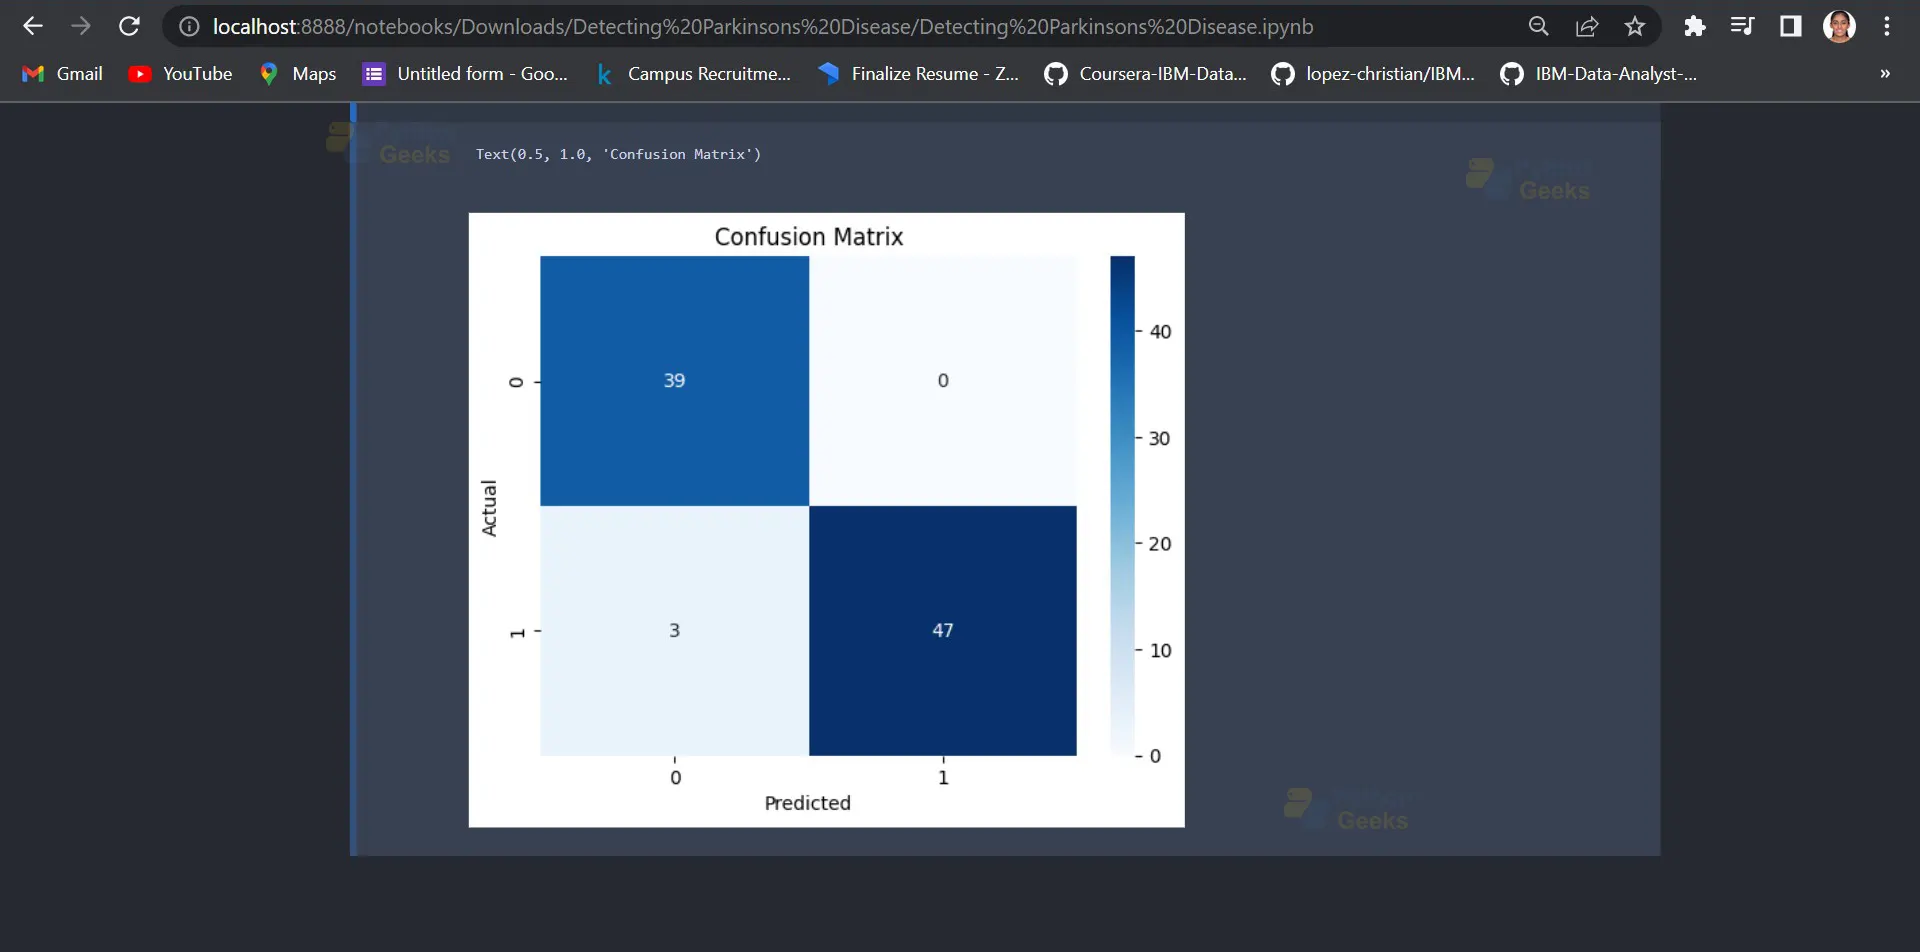
14. Plotting the confusion matrix
sns.heatmap(confusion, cmap='Blues', annot=True, fmt='g')
plt.xlabel('Predicted')
plt.ylabel('Actual')
plt.title('Confusion Matrix')
That shows the true positive, false positive, true negative, and false negative values of a classifier’s predictions for a binary classification problem.
The sns.heatmap() function is used to generate the heatmap plot. The confusion variable is passed as an argument to this function, which contains the confusion matrix that was computed earlier. The cmap=’Blues’ argument sets the color scheme of the heatmap to shades of blue. The annot=True argument adds the values of the confusion matrix to the heatmap cells, making it easier to read. The fmt=’g’ argument sets the format of the values to general notation, so they are displayed in a concise format. Finally, the plt.xlabel(), plt.ylabel(), and plt.title() functions are used to set the labels of the x-axis, y-axis, and title of the plot, respectively. In this case, the x-axis and y-axis labels are set to ‘Predicted’ and ‘Actual’, respectively, and the title of the plot is set to ‘Confusion Matrix’.
Output:
Summary
This project on PythonGeeks is used to develop a machine learning model that can accurately diagnose Parkinson’s disease. To achieve this, we used a dataset containing voice recordings from individuals with and without Parkinson’s disease, obtained from the UCI Machine Learning Repository.
We first performed exploratory data analysis to understand the structure and distribution of the data. We then balanced the classes using random oversampling, scaled the features using standard scaling, and split the dataset into training and testing sets. We developed a random forest classifier model and used GridSearchCV to optimise hyperparameters. The model was trained on the training set and evaluated on the testing set using a confusion matrix, classification report, and ROC curve. The results show that the model achieved an accuracy of [insert accuracy value] and an area under the ROC curve of [insert AUC value], indicating good performance in diagnosing Parkinson’s disease.
You can check out more such machine learning projects on PythonGeeks.

I was diagnosed Jan 2025 but had symptoms one year prior. I have left side tremors, rigidity, some dystonia in my toes and bradykinesia (all mild so far) but I still feel great and am able to go about my day without being on any medication. I try to exercise every day as well. I personally want to steer clear of any medication for as long as I can due to the fact that long term use of carbidopa-levodopa is commonly associated with side effects. I could fall asleep but can’t stay asleep. I wake up between 3 and 4 am every night. I used different supplements like Macuna and high doze B12 that didn’t work, so last July, i tried the PD-5 protocol—the best decision ever! My tremors eased, my strength returned, and I sleep soundly for 8 hours. I feel like a new woman, and I can walk and exercise again. We got the PD-5 Protocol from this website ww w. limitless naturalwellness. co m