Introduction to Python Pandas
Get Job-ready with hands-on learning & real-time projects - Enroll Now!
Pandas is one of the important modules that every Python developer should learn. It gives an easy way to store data, handle and analyze it.
In this article, we will get introduced to the Pandas module and we will discuss different operations in this module.
Introduction to Python Pandas Module
Pandas is a free and open-source Python module used for managing and analyzing data. It allows us to store the data in the form of tabular structure and time series. It got its name from two words ‘panel’ and ‘data’. Other details include:
1. Author: Wes McKinney
2. Stable Release: version 0.23.2; July 2018
3. Written in: Python, Cython, C
Features of Pandas Module
With Pandas we can:
1. Get data from file formats like csv, excel, etc. or create a data frame
2. Insert and delete columns in the data structures.
3. Merge and join data sets in different forms
4. Reshape and pivot data sets.
5. Align data and handle missing values
6. Manipulate data using indexing on DataFrames.
7. Perform split-apply-combine operations on data sets using the “group by” command.
8. Manipulate high-dimensional data in a data structure using a lower dimension by hierarchical axis indexing.
9. Do subsetting, indexing, and label-based slicing of large data sets.
10. Do time-series operations like generating data range, converting frequency, shifting date, lagging, analyzing, etc.
11. Iterating over a data set
12. Arrange data in ascending or descending order.
13. Filter data by using a condition.
Before seeing these operations, let us first see how to import the module.
Importing Pandas Module
To install the module we can use the following command.
pip install pandas
And then to import it into the program we can write the below statement.
import pandas
And if we want to use an aliasing name then
import pandas as pd
Dealing with Data in Files
Let us assume we have a CSV file named ‘stds.csv’ containing details of some students. Let us see how we can import the file.
Example of reading data from a csv file:
import pandas as pd
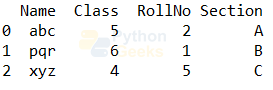
students= pd.read_csv('stds.csv') #reading data from the file and storing it in the variable
print(students)
Output:

Now let us discuss different actions we can perform on this data.
1. Getting column names:
We can use the column commands to get all the column names as shown below.
Example of getting all the column names:
print(students.columns)
Output:
We can also get some of the columns by indexing.
Example of getting the column names:
print(students.columns[1:3])
Output:
2. Checking data types:
We can find the data type of each column using the “dtypes” command.
Example of getting the data type of all columns:
print(students.dtypes)
Output:
Class int64
RollNo int64
Section object
dtype: object
To find the data type of a particular column, we can give the name of that column as a key.
Example of getting the data type of a column:
print(students['Class'].dtypes)
Output:
3. Finding shape:
We can find the shape using the “shape” command. We get the number of rows and columns as the elements of a tuple.
Example of finding shape:
print(students.shape)
Output:
We know that the tuples are ordered. So, we can use indexing to get the number of rows and columns.
Example of getting the count of rows and columns:
print("Number of rows:",students.shape[0])
print("Number of columns:",students.shape[1])
Output:
Number of columns: 4
4. Getting rows:
We can get the first few or last few rows of the tabular structure using the head() and tail() functions respectively. These functions by default give the first or last 5 rows. If we give any number as an argument then it gives those many rows.
Example of getting the first few rows:
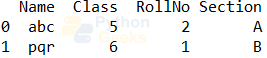
print(students.head(2))#getting the first 2 rows
Output:
Example of getting the last few rows:
print(students.head(3))#getting the last 3 rows
Output:
5. Getting unique values:
We can get the unique values from a column using the unique() function.
Example of getting unique values:
print(students.Section.unique())#printing the unique values from the section column
Output:
We can also find the number of unique values by using the nunique() function.
Example of getting unique values:
print(students.index.nunique())#printing the unique values in the index. It gives the number of rows
Output:
Dataframes in Pandas
A DataFrame is a data structure in pandas that deals with tabular data. As usual, the rows hold the observation values, and columns store the variables or attributes. The data frames can contain:
1. a NumPy array
2. a two-dimensional ndarray
3. lists, dictionaries, or Series.
4. dictionaries of one-dimensional ndarray’s
5. Pandas DataFrame
6. a Pandas Series
These data structures:
1. Are Mutable
2. Can contain variable columns
3. Can have labeled axes
4. Capable of performing arithmetic operations on columns and rows
Let us discuss some of the operations we can perform on the data frames. First, let’s start with the creation.
Operations on Python Pandas
1. Creating Data frame:
The syntax to create a data frame is
pandas.DataFrame( data, index, columns, dtype, copy)
Example of creating an empty data frame:
import pandas as pd

df = pd.DataFrame(np.nan, index=[1,2,3,4,5], columns=['clmn1'])
print(df)
Output:
Example of creating a data frame:
   clmn1
1 NaN
2 NaN
3 NaN
4 NaN
5 NaN
Output:

2. Changing Index:
We can set the indeed of our choice by using the ‘index’ command.
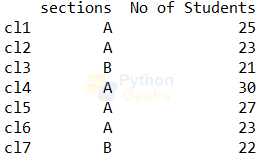
Example of changing index:
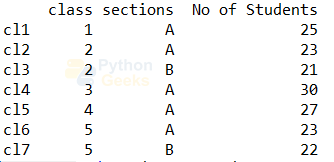
cls.index=['cl1','cl2','cl3','cl4','cl5','cl6','cl7']
print(cls)
Output:
3. Getting column(s) values:
We can get the values of a column by using the column names as a key.
Example of a column’s values:
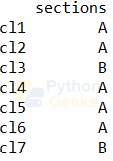
print(cls['sections'])
Output:

If we want the column name along with the details, we can write the below code.
Example of a column’s values:
print(cls[['sections']])
Output:
To get the details of multiple columns, we can mention the column names in the square brackets.
Example of multiple column values:
print(cls[['sections','No of Students']])
Output:
4. Slicing in Pandas:
We can use the concept of slicing on data frames too. Using this, we can get
Example of multiple column values:
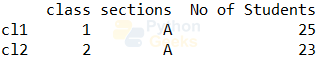
print(cls[0:2]) #printing the first two columns
Output:
5. Loc and iloc functions:
These are the two functions that can be used to select certain rows. The difference between them is the iloc takes the integer indexes as input and the loc takes the index names.
Example of loc:
print(cls.loc[['cl3','cl5']]) #printing the third and fifth rows
Output:

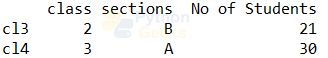
Example of iloc:
print(cls.iloc[2:4]) #printing the third and fourth rows
Output:
Changing the Data frame
Let us consider the following data frame.
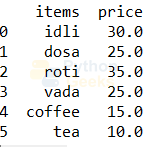
Example of creating a data frame:
import pandas as pd

items=['idli','dosa','roti','vada','coffee','tea']
price=[30,25,35,25,15,10]

menu=pd.DataFrame({'items':items,'price':price})
print(menu)
Output:

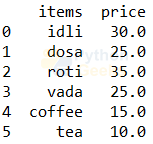
1. Changing data type:
We can change the data type of values of columns by using the “astype” command.
Example of changing data type:
menu.price=menu.price.astype(float)
print(menu)
Output:
2. Finding the number of occurrences:
We can use the value_counts() function to get the number of occurrence.
Example of finding number of occurence:
print(menu.price.value_counts())
Output:
10.0 1
15.0 1
35.0 1
30.0 1
Name: price, dtype: int64
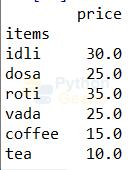
3. Setting a column as index:
We can use set_index() function to set a column as an index by giving the column name as an argument.
Example of setting a column as index:
menu.set_index('items',inplace=True)
print(menu)
Output:
Here when the “in_place: parameter is set True, then the original data frame will also get affected. We can reset it back by using reset_index() function.
menu.reset_index(inplace=True)
4. Sorting:
We can sort the data in the data frame with respect to a column using the sort_values() function.
Example of sorting:
menu.sort_values('price',ascending=False)
print(menu)
Output:
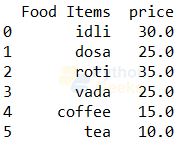
5. Renaming columns:
We can equate the columns to the list of new names. We can also use the rename() function.
Example of renaming columns:
menu.columns=['Food Items','price']
print(menu)
Or
menu.rename(columns={'items':'Food Items'},inplace=True)
print(menu)
Output:
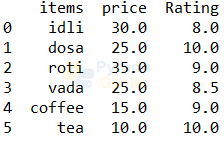
6. Creating new columns:
We can use the column name as a key and equate it to the list of values to create a column.
Example of creating a column:
menu['Rating']=[8,10,9,8.5,9,10]
print(menu)
Output:
7. Dropping columns or rows:
We can drop a column or a row using the drop function. This function takes the column name or row index as the first argument and the axis as the second argument. The axis is either 0 or 1 that decides if it is the row or column that is to be deleted.
Example of deleting a column:
print(menu.drop('Rating',axis=1))
Output:

Here, we did not set in_place to True. So, it will not reflect on the original menu data frame.
Other Pandas operations
1. Describe:
We can use the describe() function to get statistical information of the numerical columns in the data frame.
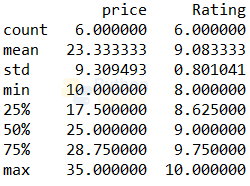
Example of describe():
print(menu.describe())
Output:
We can also get any of these values of a particular column.
Example of finding minimum price:
print(menu.price.min())
Output:
2. Groupby:
We can use the groupby command to apply any operation by considering the values of a category as a single group.
Example of groupby:
print(menu.groupby('Rating').price.max())
Output:
We can use agg() function to get multiple values.
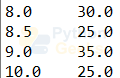
Example of groupby:
print(menu.groupby('Rating').price.agg(['min','max','mean']))
Output:

3. Filtering:
We can do filtering by setting the condition in the brackets.
Example of filtering:
print(menu[menu.Rating==10])
Output:

Another way to do the above filtering is by using the loc() function.
menu.loc[menu.Rating==10,:]
Example of filtering:
print(menu[menu.Rating.isin([10,9])])
Output:

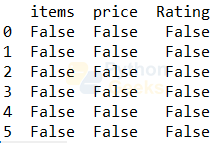
4. Missing values:
We can use the isnull() and notnull() function to check for null and not null values.
Example of handling missing values:
print(menu.isnull())
Output:
Example of handling missing values:
print(menu.isnull().sum())
Output:
price 0
Rating 0
dtype: int64
We can also use dropna() and fillna() functions to remove and fill the null values.
5. Rank:
We can rank the columns using the rank() function.
Example of ranking:
print(menu.rank())
Output:

6. Concatenation:
We can concatenate using the concat() function.
Example of concatenation:
print(pd.concat([menu,menu]))
Output:

7. Iteration:
We can iterate over the data frame by using the loops.
Example of iterating over the data frame:
for index, row in menu.iterrows() :
    print(row['items'], row['price'],row['Rating'])
Output:
dosa 25.0 10.0
roti 35.0 9.0
vada 25.0 8.5
coffee 15.0 9.0
tea 10.0 10.0
Pandas Series
The Pandas series are one dimensional arrays with heterogeneous data and indexed.
Example of series:
print(pd.Series([1,'a',4.5]))
Output:
1 a
2 4.5
dtype: object
Example of series:
print(pd.Series({1:1,2:4,3:9}))
Output:
2 4
3 9
dtype: int64
Pandas Panels
The panels are used to store data in 3 dimensions. Remember, the term ’pan’ in pandas is derived from ‘panel’. The panel can be created by following the below syntax.
pd.Panel(data, items, major_axis, minor_axis, dtype, copy)
Here, the parameters are:
1. data: It can take different structures including ndarray, series, map, lists, dict, constants, and also DataFrame
2. items: It is axis 0. And each item represents the data frame inside the panel.
3. major_axis: It is axis 1. It is the index or row number of each data frame.
4. minor_axis: It is axis 2. It represents columns of the data frames.
5. dtype: It contains information about the data type of each column.
6. copy: It is False by default. If set True it means the data needs to be copied.
This data structure has been removed from the recent version of pandas.
Interview Questions on Python Pandas
1. Write a program to find the data type of a particular column named ‘clmn’ in the data frame ‘df’.
Ans. Below is the Example:
print(df[‘clmn’ ].dtypes)
2. Write a program to set a column named ‘clmn’ as the index of the data frame df.
Ans. Below is the example:
df.set_index(‘clmn’ ,inplace=True)
3. Write a program to remove all the rows having null values of the data frame df.
Ans. Below is the example:
df = df.dropna()
4. Write a program to concatenate two data frames df1 and df2 horizontally in Pandas.
Ans. Below is the example
df= pd.concat([df1, df2], axis=1)
5. Write a program to save the data frame df as a CSV file in Python pandas
Ans. Below is the example:
df.to_csv('file.csv')
Quiz on Python Pandas
Conclusion
In this article, we discussed the basic important concepts of the Python module. We covered handling data from files and the data frames. Then we saw series and panels in pandas. Finally, we saw some interview questions.
Hoping that all the topics covered are understood. Happy learning!

i have a great experience ever when i found this website