Drawing Functions in OpenCV for Line, Rectangle, Circle and Ellipse
Get ready to crack interviews of top MNCs with Placement-ready courses Learn More!
In this article, we’ll learn how to create geometric shapes such as lines, rectangles, and circles using the built-in drawing functions in OpenCV. Drawing geometric shapes over an image or video is a method to bound objects, or localize objects in computer vision tasks. These functions can also be used to create various shapes in OpenCV.
Drawing Functions in OpenCV
Create Line in OpenCV using cv2.line()
In geometry, a part of a line that is bounded by two distinct endpoints, and contains every point between its endpoints on the line is called a line segment.
This function is used to draw a line segment that connects any two points. It draws a line between points p1 and points p2. The line gets clipped by the boundaries of the image.
Syntax:
cv2.line(img, pt1, pt2, color, thickness, lineType, shift)
Parameters
img: Source image or image over which we have to draw the line
pt1: Starting coordinates of the line segment.
pt2: Ending coordinates of the line segment
color: The color of the line
thickness: Thickness of the line
lineType: Type of the line offered by OpenCV
shift: Fractional bits in the point coordinates
Implementation
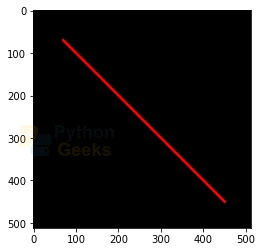
In the given program, we draw a line segment using the line function provided in OpenCV over a blank image created using the NumPy function.
The first argument given to the function is the blank image on which we will draw the line segment. The second argument is the starting coordinate of the line segment pt1, (x,y). We have specified the starting point as (70,70). The third argument is the coordinate for the endpoint of the line segment pt2, (x,y). We have specified the endpoint of the line segment as (450, 450). Lastly, we specify the color and the thickness of the line segment. We have set the color of the line segment as red by passing a tuple of values (255,0,0) and have set the thickness to 5.
# Importing OpenCV
import cv2

# Importing numpy
import numpy as np

# Importing matplotlib.pyplot
import matplotlib.pyplot as plt

# Creating a blank image to work with
blank_img = np.zeros(shape=(512,512,3), dtype=np.int16)

# Displaying the blank image
plt.imshow(blank_img)

# Creating a line using the cv2.line function
cv2.line(blank_img, pt1=(70,70), pt2=(450,450), color=(255,0,0),thickness=5)

# Displaying the image with the line created on it
plt.imshow(blank_img)
Create Rectangle in OpenCV using cv2.rectangle()
This function is used to create a rectangle in OpenCV. A rectangle can be defined as a plane figure with four straight sides and right angles, and unequal adjacent sides. The opposite corners of the rectangle represent the two points pt1 and pt2.
Syntax:
cv2.rectangle(img, pt1, pt2, color, thickness, lineType, shift)
Parameters
Img: Source image or image over which we have to draw the line
Pt1: Starting coordinate of the rectangle
Pt2: Ending coordinate of the triangle on the opposite
Color: Color of the rectangle
Thickness: Thickness of the lines of the rectangle. Negative thickness refers to a filled rectangle
lineType: Type of the line offered by OpenCV
Shift: Fractional bits in the point coordinates
Implementation
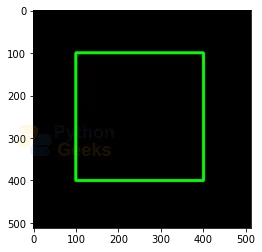
In the given program, we draw a rectangle using the rectangle function provided in OpenCV over a blank image created using the NumPy function.
The first argument given to the function is the blank image on which we will draw the rectangle. The second argument is the starting coordinate of the vertice of the rectangle (x,y). We have specified the starting point as (100,100). The third argument is the terminating coordinate for the vertice of the rectangle (x,y).
We have specified the endpoint of the rectangle as (400, 400). Lastly, we specify the color and the thickness of the edges of the rectangle. We have set the color of the rectangle as green by passing a tuple of the value (0, 255, 0) and the thickness of the rectangle borders as 5.
If we wish to create a filled rectangle, the thickness has to be set to -1.
# Importing OpenCV
import cv2

# Importing numpy
import numpy as np

# Importing matplotlib.pyplot
import matplotlib.pyplot as plt

# Creating a blank image to work with
blank_img = np.zeros(shape=(512,512,3), dtype=np.int16)

# Displaying the blank image
plt.imshow(blank_img)
# Creating a rectangle using the cv2.rectangle function
cv2.rectangle(blank_img, pt1=(100,100), pt2=(400,400),color=(0,255,0),thickness=5)

# Displaying the blank image with the rectangle
plt.imshow(blank_img)
Create clipped segment in OpenCV using cv2.clipline()
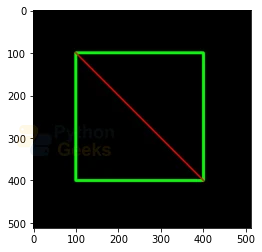
The cv2.clipLine() function returns a clipped segment defined inside the rectangle. If both the points of the segment, pt1 and pt2 are outside the rectangle, then the return value is False, otherwise, if some of the points of the clip segment are inside the rectangle, then the return value is true.
Syntax
cv2.clipLine(imgSize, pt1, pt2)
Parameters
imgSize: Size of the image. The rectangle is defined as rect( 0, 0, imgSize.width, imgSize.height)
pt1: Starting coordinate for the clip line
pt2: Ending coordinate for the clip line
Implementation
# Importing OpenCV
import cv2

# Importing numpy
import numpy as np

# Importing matplotlib.pyplot
import matplotlib.pyplot as plt

# Creating blank image
blank_img = np.zeros(shape=(512,512,3), dtype=np.int16)

# Displaying the blank image
plt.imshow(blank_img)
# Creating a rectangle using the cv2.rectangle function
cv2.rectangle(blank_img, (100, 100), (400, 400), (0,255,0), 5)

# Creating a clipline using the cv2.cliLine function
ret, pt1, pt2 = cv2.clipLine((0,0,500,500), (100, 100), (400, 400))
if ret:
  cv2.line(blank_img,pt1,pt2,(255,0,0),3)

# Displaying the blank image with the clipline
plt.imshow(blank_img)
Create circle in OpenCV using cv2.circle()
A circle consists of all points in a plane that are at a given distance from the center and equivalently it is the curve traced out by a point that moves in a plane with the distance from the center remaining constant. The distance from the center to the traced curve is termed as the radius of the circle. The cv2.circle function is used to draw a circle of the given radius. The center of the circle refers to the coordinate of the window where the center of the circle will be drawn.
Syntax
cv2.circle(img, center, radius, color, thickness, lineType, shift)
Parameters
Img: Source image or image over which we have to draw the line
Center: Coordinate where the center of the circle will be drawn
Radius: Radius of the circle
Color: Color of the circle
Thickness: Thickness of the lines of the circle. Negative thickness refers to a filled circle.
lineType: Type of the line offered by OpenCV
Shift: Fractional bits in the point coordinates
Implementation
In the given program, we draw a circle using the circle function provided in OpenCV over a blank image created using the NumPy function.
The first argument given to the function is the blank image on which we will draw the circle. The second argument coordinates for the point where the center of the circle will be drawn (x,y). We have specified the center point as (250,250). The third argument receives the value for the radius of the circle. We have specified the radius as 100.
Lastly, we specify the color and the thickness of the edges of the circle. We have set the color of the circle as red by passing a tuple of the value (255, 0, 0) and the thickness of the circle as 10.
If we wish to create a filled circle, the thickness has to be set to -1.
# Drawing a hollow circle

# Importing OpenCV
import cv2

# Importing numpy
import numpy as np

# Importing matplotlib.pyplot
import matplotlib.pyplot as plt

# Creating a blank image to work with
blank_img = np.zeros(shape=(512,512,3), dtype=np.int16)

# Displaying the blank image
plt.imshow(blank_img)
# Creating a hollow circle using the cv2.circle function
cv2.circle(blank_img, center=(250,250),radius=100,color=(255,0,0),thickness=10)

# Displaying the blank image with the circle
plt.imshow(blank_img)

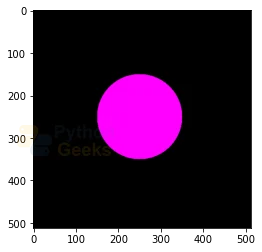
Implementation for Drawing a filled circle with a negative thickness
# Importing OpenCV
import cv2

# Importing numpy
import numpy as np

# Importing matplotlib.pyplot
import matplotlib.pyplot as plt

# Creating a blank image to work with
blank_img = np.zeros(shape=(512,512,3), dtype=np.int16)

# Displaying the blank image
plt.imshow(blank_img)
# Creating a filled circle using the cv2.circle function
cv2.circle(blank_img, center=(250,250),radius=100,color=(255,0,255),thickness=-1)

# Displaying the blank image with the circle
plt.imshow(blank_img)
Create eclipse in OpenCV using cv2.ellipse function
This function is used to draw an ellipse outline, a filled ellipse, or an arc over any image. For this function, we need to specify the major and minor axis of the ellipse, the angle of rotation, and the starting and ending angles. These parameters are specified to draw an arc.
We can create an ellipse with horizontal and vertical orientation.
Syntax
cv2.ellipse(src, center, axes, angle, startAngle, endAngle, color, thickness lineType, shift)
Parameters
src: Source image or image over which we have to draw the ellipse
center: Coordinate where the center of the ellipse will be drawn. It is represented by a tuple.
axes: Tuple containing the length of the major and minor axes.
angle: Rotation angle
startAngle: Starting angle
endAngle: Ending angle
color: Color of the border of the ellipse
thickness: Thickness of the border
lineType: Type of line. It is an optional parameter.
shift: Fractional bits in the point coordinates
Implementation
In the given program, we draw an ellipse using the ellipse function provided in OpenCV over a blank image created using the NumPy function.
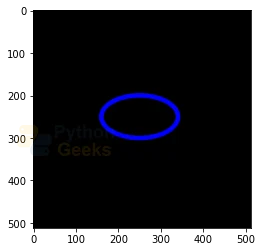
The first argument given to the function is the blank image on which we will draw the ellipse. The second argument coordinates for the point where the center of the ellipse will be drawn (x,y). We have specified the center point as (250,250). The third argument receives the value for the length of the major and minor axes as a tuple. We have specified the major and minor axes as 90 and 50. Then, we specify the angle, the start angle and the end angle.
Lastly, we specify the color and the thickness of the edges of the ellipse. We have set the color of the rectangle as blue by passing a tuple of the value (0, 0, 255) and the thickness of the circle as 10.
If we wish to create a filled ellipse, the thickness has to be set to -1.
# Importing OpenCV
import cv2

# Importing numpy
import numpy as np

# Importing matplotlib.pyplot
import matplotlib.pyplot as plt

# Creating blank image
blank_img = np.zeros(shape=(512,512,3), dtype=np.int16)

# Displaying the blank image
plt.imshow(blank_img)
# Creating ellipse using the cv2.ellipse function
cv2.ellipse(blank_img, (250,250), (90,50), 0, 0, 360, (0,0,255), 10)

# Displaying the blank image with the ellipse
plt.imshow(blank_img)
Display Text data in OpenCV using cv2.putText()
The function cv2.putText displays the specified text data over an image in OpenCV. To put text over images, we need to specify the text data, the position of the coordinates of the image where the text will be displayed, font type and scale of the text data, and other parameters such as color, thickness, and lineType.
Syntax
cv2.putText(src, text, org, font, scale, color, thickness, lineType, bottomLeftOrigin)
Parameters
src: Source image or input image over which we’ll write
text: Text to be written
org: Specified as the bottom-left corner of the text
font: Font of the text
scale: Scale factor to be multiplied with the base size of a font
color: Color of the text
thickness: The thickness of the text
lineType: Type of line
bottomLeftOrigin: It specifies the org to be bottom-left corner if true, otherwise, top-left corner
Implementation
In the given program, we have written a text using the putText function provided in OpenCV over a blank image created using the NumPy function.
The first argument given to the function is the blank image on which we write the text. The second argument is the text that we have to put over the image. The third argument specifies the position of the starting of the string over the image. We have specified the starting point as (70,300).
The next arguments take the value for the fontType and fontScale. We can specify any font from the different font options available in OpenCV. Lastly, we specify the color, thickness and the lineType of the text.
# Importing OpenCV
import cv2

# Importing numpy
import numpy as np

# Importing matplotlib.pyplot
import matplotlib.pyplot as plt

# Creating blank image
blank_img = np.zeros(shape=(512,512,3), dtype=np.int16)

# Displaying the blank image
plt.imshow(blank_img)
# Writing text over blank image using the cv2.putText function
font = cv2.FONT_HERSHEY_SIMPLEX
cv2.putText(blank_img,text='PythonGeeks',org=(70,300),fontFace=font,fontScale=2,color=(255,255,255), thickness=5, lineType=cv2.LINE_AA)

# Displaying the blank image with the text
plt.imshow(blank_img)

Conclusion
In this article, we looked at the geometric functions that OpenCV offers for drawing different shapes. We understood how to draw a line, rectangle, clipline, circle, ellipse and how to put text over an image using the built-in functions present in the OpenCV library and implemented them.
