Draw Polylines, fillPoly, fillConvexPoly and ArrowedLine in OpenCV
Master programming with our job-ready courses: Enroll Now
In this article, we’ll understand how to create some complex geometric shapes using the built-in functions offered by the OpenCV library. These functions can also be used to create various shapes in computer vision applications.
Functions to draw complex shapes in OpenCV
1. cv2.polylines() in OpenCV
Polylines can be defined as a connected sequence of line segments to create a single object. Polylines can create open objects or closed objects. In OpenCV cv2.polylines() method is provided to draw a polygon on an image.
Syntax
cv2.polylines(image, [pts], isClosed, color, thickness)
Parameters
- img: It is the image on which we are going to draw
- pts: Coordinates of the vertices of the polygon
- isClosed: Specifies whether the polygon is closed or not
- color: Specifies the color of the polygon
- thickness: It is the thickness of the polyline edges.
- Return Value: Returns an image with polygon drawn on it.
Implementation
In the given program, we draw connected objects using the polylines function provided in OpenCV over an image created using the NumPy function.
The first argument given to the function is the image on which we will draw the polylines. The second argument is the vertices of the polygon passed as an array of points of each vertice of the polygon (x,y).The third argument passed specifies whether the object created using the polylines function is closed or not. Lastly, we specify the color and the thickness of the edges of the polygon. We have set the color of the polygon as blue by passing a tuple of the value (0, 0, 255) and the thickness as 10.
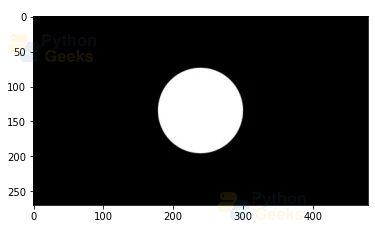
# Importing OpenCV
import cv2

# Importing numpy
import numpy as np

# Importing matplotlib.pyplot
import matplotlib.pyplot as plt

# Reading an image around which we will draw the polygon
img = cv2.imread(r'C:\Users\tushi\Downloads\PythonGeeks\circle.jpg')

# Displaying the image
plt.imshow(img)
# Storing height and width of the image in the variables height and width
height, width = img.shape[:2]

# Storing height and width of the image divided by 2 in the variables changed_height and changed_width
changed_height, changed_width = int(height/2), int(width/2)

# Creating an array of vertice coordinates for the polygon
pts = np.array([[0, changed_height],[changed_width, height], [width, changed_height],[changed_width,0]])

# Creating the polygon using the polylines function
cv2.polylines(img, [pts], isClosed= True, color=(0,0,255), thickness=10)

# Displaying the image with the polygon drawn on it
plt.imshow(img)

2. cv2.fillPoly() in OpenCV
cv2.fillPoly() method is provided by OpenCV to draw a filled polygon on an image.
Syntax
cv2.fillPoly(img, [pts], color, lineType, shift, offset)
Parameters
- img: It is the image on which we are going to draw
- pts: Coordinates of the vertices of the polygon
- color: Specifies the color of the polygon
- lineType: Line type of the boundary of the polygon
- shift: Fractional bits in the vertex coordinates
- offset: The offset value by which all the points in the polygon will be shifted
- Return Value: Returns an image with a filled polygon drawn on it.
Implementation
In the given program, we create filled polygons using the fillPoly function provided in OpenCV over a blank image created using the NumPy function.
The first argument given to the function is the image on which we will draw the filled polygons. The second argument is the vertices of the polygon passed as an array of points of each vertice of the polygon (x,y). LineType, shift and offset are optional parameters. Lastly, we specify the color of the polygon. We have set the color of the polygon as green by passing a tuple of the value (0, 255, 0).
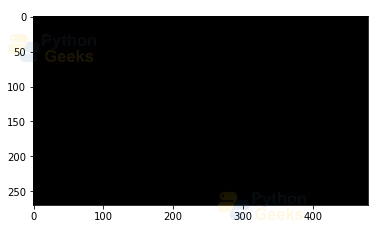
# Importing OpenCV
import cv2

# Importing numpy
import numpy as np

# Importing matplotlib.pyplot
import matplotlib.pyplot as plt

# Creating a blank image to work with
blank_img = np.zeros(shape=(270, 480, 3), dtype=np.int16)

# Displaying the blank image
plt.imshow(blank_img)
# Storing height and width of the image in the variables height and width
height, width = img.shape[:2]

# Storing height and width of the image divided by 2 in the variables changed_height and changed_width
changed_height, changed_width = int(height/2), int(width/2)

# Creating an array of coordinates for the polygon
pts = np.array([[0, changed_height],[changed_width, height], [width, changed_height],[changed_width,0]])

# Creating the filled polygon using the filledPoly function
cv2.fillPoly(blank_img, [pts], color=(0,255,0))

# Displaying the image with the polygon drawn on it
plt.imshow(blank_img)

3. cv2.fillConvexPoly() in OpenCV
A convex polygon is a polygon in which the line segments between the points don’t go inside and the vertices of the polygon are pointed outwards. The interior angles are less than 180°. cv2.fillConvexPoly() method is provided by OpenCV to draw a filled convex polygon on an image. The fillConvexPoly function is considerably faster than the fillPoly function.
Syntax
cv2.fillConvexPoly(img, pts, color, lineType, shift)
Parameters
- img: It is the image on which we are going to draw
- pts: Coordinates of the vertices of the polygon
- color: Specifies the color of the polygon
- lineType: Line type of the boundary of the polygon
- shift: Fractional bits in the vertex coordinates
- Return Value: Returns an image with a filled convex polygon drawn on it.
Implementation
In the given program, we create filled convex polygons using the fillConvexPoly function provided in OpenCV over a blank image created using the NumPy function.
The first argument given to the function is the image on which we will draw the filled polygons. The second argument is the vertices of the polygon passed as an array of points of each vertice of the polygon (x,y). LineType, and shift are optional parameters. Lastly, we specify the color of the polygon. We have set the color of the filled polygon as red by passing a tuple of the value (255, 0, 0).
# Importing OpenCV
import cv2

# Importing numpy
import numpy as np

# Importing matplotlib.pyplot
import matplotlib.pyplot as plt

# Creating a blank image to work with
blank_img = np.zeros(shape=(350,560,3), dtype=np.int16)

# Displaying the blank image
plt.imshow(blank_img)
# Storing height and width of the image in the variables height and width
height, width = blank_img.shape[:2]

# Storing height and width of the image divided by 2 in the variables changed_height and changed_width
changed_height, changed_width = int(height/2), int(width/2)

# Creating an array of coordinates for the polygon
pts = np.array([[0, changed_height],[changed_width, height], [width, changed_height],[changed_width,0]])

# Creating the convex polygon using the fillConvexPoly function
cv2.fillConvexPoly(blank_img, pts, color=(255,0,0))

# Displaying the image with the polygon drawn on it
plt.imshow(blank_img)

4. cv2.arrowedLine() in OpenCV
An arrowed line is a line segment shaped like an arrow, or marked by arrowheads. cv2.arrowedLine() method is provided by OpenCV to draw an arrowed segment pointing from the first point to the second one over an image.
Syntax:
cv2.arrowedLine( img, pt1, pt2, color, thickness, lineType, shift, tipLength)
Parameters
- img: It is the image that we are going to draw on
- pt1: The starting coordinate for the arrowed line
- pt2: The ending coordinate for the arrowed line
- color: Color of the arrowed line
- thickness: The thickness of the arrowed line
- lineType: Type of line
- shift: Fractional bits in point coordinates
- tipLength: Relation of the length of the arrow tip with the arrow length
- Return Value: Returns an image with an arrowed line drawn on it.
Implementation
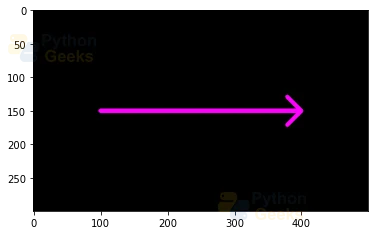
In the given program, we create an arrowed line using the arrowedLine function provided in OpenCV over a blank image created using the NumPy function.
The first argument given to the function is the blank image on which we will draw the line segment. The second argument is the starting coordinate of the arrowed line segment pt1, (x,y). We have specified the starting point as (100,150). The third argument is the coordinate for the endpoint of the arrowed line segment pt2, (x,y).
We have specified the endpoint of the line segment as (400, 150). Lastly, we specify the color and the thickness of the arrowed line. We have set the color of the line segment as purple by passing a tuple of values (255,0,255) and have set the thickness to 5.
# Importing OpenCV
import cv2

# Importing numpy
import numpy as np

# Importing matplotlib.pyplot
import matplotlib.pyplot as plt

# Creating a blank image to work with
blank_img = np.zeros(shape=(300,500,3), dtype=np.int16)

# Displaying the blank image
plt.imshow(blank_img)
# Creating the arrowed line using the arrowedLine function
cv2.arrowedLine(blank_img, pt1=(100,150), pt2=(400,150), color=(255,0,255), thickness=5)

# Displaying the image with the polygon drawn on it
plt.imshow(blank_img)
5. cv2.getTextSize() in OpenCv
The getTextSize function in OpenCV is used to compute the height and width of a text string.
Syntax
cv2.getTextSize(text, fontFace, fontScale, thickness)
Parameters
- text: The input text string whose height and width will be calculated
- fontFace: Style of the font
- fontScale: Scale factor multiplied with the base size of the font
- thickness: Thickness of the lines of the text
- Return value: The function returns the y-coordinate of baseline. The baseline refers to the bottom most point of the text string.
Implementation
In the given program, we have created a box for the given text string by computing the height and width of the text string. We have embedded the text on the box using the putText function.
The first parameter given to the getTextSize function is the text, which we have set as ‘PythonGeeks’, second parameter is the fontFace which has been set to Hershey simplex font. The third parameter is the font scale which has been given as 2. The last parameter given to the getTextSize function is the thickness of the text, which has been set to 2. We have set the background color for the box as white and the font color as black.
# Importing OpenCV
import cv2

# Importing numpy
import numpy as np

# Importing matplotlib.pyplot
import matplotlib.pyplot as plt

# Defining the parameters for text
FONT = cv2.FONT_HERSHEY_SIMPLEX
FONT_SCALE = 2.0
FONT_THICKNESS = 2
bg_color = (255, 255, 255)
text_color = (0, 0, 0)

# Defining the text string for computation of height and width
text = 'PythonGeeks'

# Setting the size of the text box
(text_width, text_height), baseline = cv2.getTextSize(text, FONT, FONT_SCALE, FONT_THICKNESS)
text_patch = np.zeros((text_height + baseline, text_width, 3), np.uint8)
text_patch[:,:] = bg_color

# Embedding text on the box using the putText function
cv2.putText(text_patch, text, (0, text_height), FONT, FONT_SCALE, text_color, FONT_THICKNESS)

# Displaying the text
plt.imshow(text_patch)

6. cv2.ellipse2Poly()
The ellipse2Poly function in OpenCV is used to approximate an elliptic arc with a polyline. It calculates the vertices of a polyline that is used to approximate the elliptic arc.
Syntax
cv2.ellipse2Poly(center, axes, angle, arcStart, arcEnd, delta)
Parameters
- center: Center of the elliptic arc
- axes: It is half of the size of the main axes of the ellipse
- angle: It is the rotation angle in degrees
- arcStart: The starting angle for the elliptic arc
- arcEnd: The ending angle for the elliptic arc
- delta: It is the angle between the polyline vertices.
- Return value: The return for this function is an array containing the vertices of the polylines.
Implementation
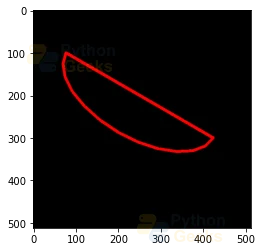
In the given program, we have defined an elliptic arc using the ellipse2Poly function. The first parameter given to the function is the center of the elliptic arc, we have given the center as (250, 200). The second parameter defines the axes of the elliptic arc, it has been set to (100, 50). The next parameters define the rotation angle of the elliptic arc, the starting angle of rotation and the ending angle of rotation.
The rotation angle has been set to 30 degrees, the starting angle has been set to 0 degrees and the ending angle has been set to 180 degrees. The angle between the polyline vertices has been set to 15 degrees.
The ellipse2Poly function returns an array containing the vertice points of the polylines. Using the returned array, the ellipse can be plotted. We give the array of points to the cv2.polylines function.
# Importing OpenCV
import cv2

# Importing numpy
import numpy as np

# Importing matplotlib.pyplot
import matplotlib.pyplot as plt

# Creating a blank image to work with
blank_img = np.zeros(shape=(512,512,3), dtype=np.int16)

# Displaying the blank image
plt.imshow(blank_img)
# Creating an ellipse using the ellipse2Poly function
cv2.ellipse2Poly((250, 200),(100, 50),30,0,180,15)

# Output is a vector of the vertices of polylines
array([[207, 150],
       [164, 166],
       [ 95, 143],
       [ 41,  95],
       [ 33,  50]], dtype=int32)

# Creating a polygon using the cv2.polyline function. The array of points is returned from the ellipse2Poly function
cv2.polylines(blank_img, [points], True, (255,0,0), 5)

# Plotting the blank image with the ellipse plotted using the cv2.ellipse2Poly function
plt.imshow(blank_img)
Conclusion
In this article, we looked at the geometric functions that OpenCV offers to create complex shapes. We understood how to create polygons, filled polygons, filled convex polygons, and arrowed lines using the built-in functions present in the OpenCV library. Furthermore, we understood the getTextSize function and ellipse2Poly function in OpenCV and implemented them.
