Data Wrangling in Python with Examples
Boost Your Career with In-demand Skills - Start Now!
Processing data is a very important part of the analysis, and to use them for other purposes. This process is called data wrangling.
In this article, we will be learning about data wrangling and the different operations we can perform on data using Pandas Python modules. Let us start with the introduction to data wrangling.
What Is Data Wrangling?
Data Wrangling is the process of collecting, and modifying the raw data into another form for analyzing and decision-making easily. It is also known as Data Munging. For example, when we want only some part of the data that is useful based on the application, then we can do data wrangling. This process is widely used in the data science domain.
Modules to be Installed
As said before, we will be using the Pandas module. We can install this module by using the below statement.
pip install pandas
Data Wrangling Operations in Python
Using the above mentioned modules, we can do the below operation for data wrangling:
1. Handling missing or null values
2. Grouping Data
3. Reshaping the data: In this process, data is manipulated according to the requirements, where new data can be added or pre-existing data can be modified.
4. Filtering the data: Sometimes datasets are composed of unwanted rows or columns which are required to be removed or filtered, etc.
We will be discussing these operations in further sections.
Handling Missing Values
Most of the datasets having contained missing values of NaN or null. We can handle these using the Python pandas module by either deleting them or replacing them with mean, mode, the most frequent value of the column. Before that, let us see the data we are going to deal with.
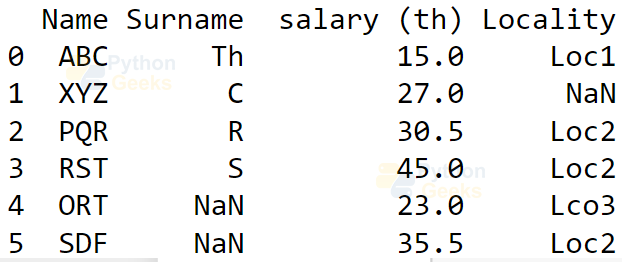
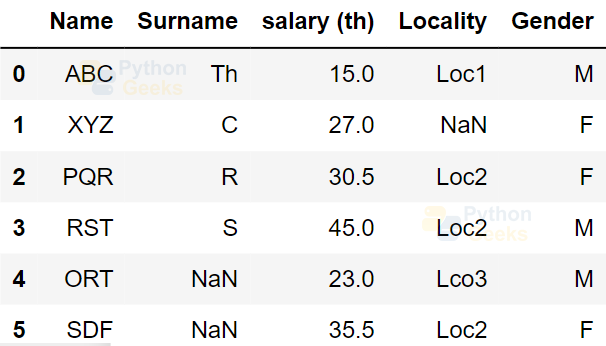
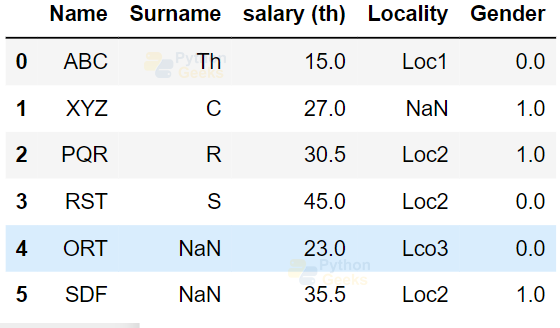
Example of CSV file as a data frame:
import pandas as pd #importing the module

dataFrame=pd.read_csv('data.csv')
print(dataFrame)
Output:
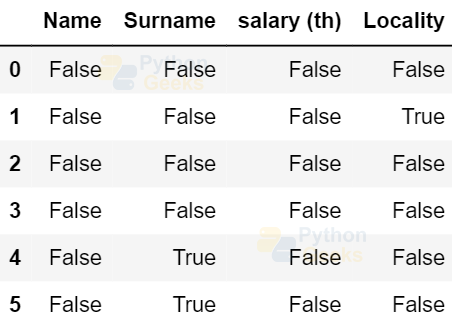
1. Finding Missing Values
We can find the missing values using isnull() function.
Example of finding missing values:
dataFrame.isnull()
Output:
Example of finding missing values:
dataFrame.isnull().any()
Output:
Surname True
salary (th) False
Locality True
dtype: bool
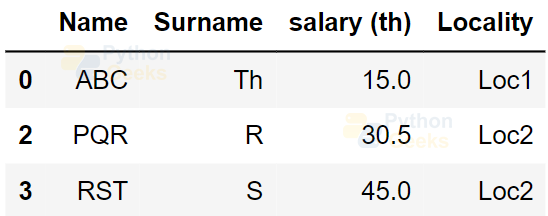
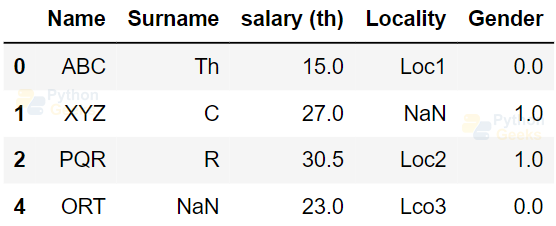
2. Removing Missing Values
Example of dropping missing values:
dataFrame.dropna()
Output:
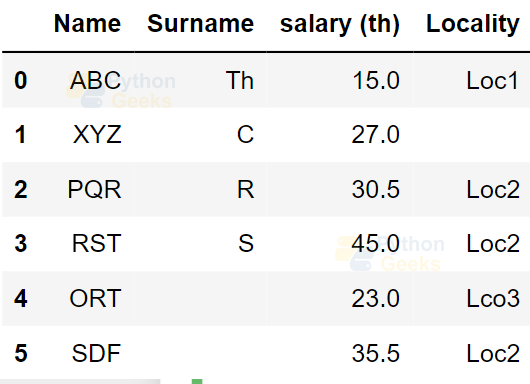
3. Replacing with a value
Example of replacing missing values with a constant value:
dataFrame.fillna('')
Output:
We can also use replace() function to replace with a constant value or with mean or other function.
Reshaping Data
Before doing this, first let us add a column named ‘Gender’.
Example of adding a column:
dataFrame['Gender']=['M','F','F','M','M','F']
dataFrame
Output:
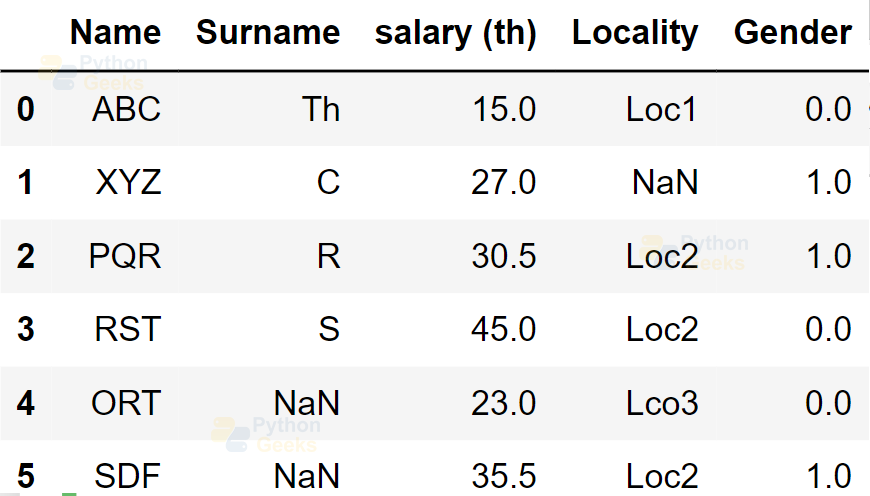
We can reshape the data by replacing the data by categorizing and numbering.
Example of reshaping data:
dataFrame['Gender'] = dataFrame['Gender'].map({'M': 0,
                                 'F': 1, }).astype(float)
dataFrame
Output:
Grouping Data
We can use the groupby() method that returns a DataFrameGroupBy object. And by calling the method like value_counts() on the object obtained, we can get the number of occurrences for each unique value in the specified column.
Example of grouping data:
dataFrame.groupby('Locality').Gender.value_counts()
Output:
Lco3 0.0 1
Loc1 0.0 1
Loc2 1.0 2
0.0 1
Name: Gender, dtype: int64
The obtained output shows the correlation between the columns Gender and Locality. We can also find the unique values as shown in the below example.
Example of getting unique values from a column:
dataFrame.Locality.unique()
Output:
Filtering Data
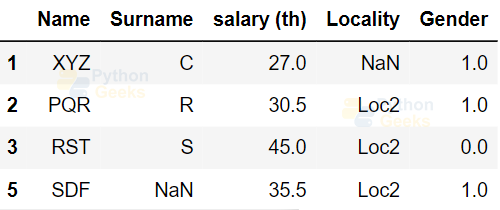
We can filter the data by specifying different conditions.Let us see some examples.Example of filtering data:
dataFrame[dataFrame['salary (th)']>25]
Output:
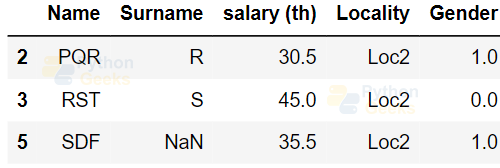
Example of filtering data:
dataFrame[dataFrame['Locality']=='Loc2']
Output:
Merging Data
We can merge two data sets based on a column. For this, let us create another data frame.
Example of creating a data frame:
df2 = pd.DataFrame(
    {'Name': ['ABC', 'XYZ', 'PQR', 'RST','ORT', 'SDF'],
     'clmn': [1,2,6,9,'NIL',4]})
df2
Output:
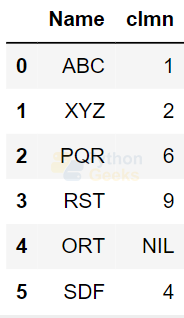
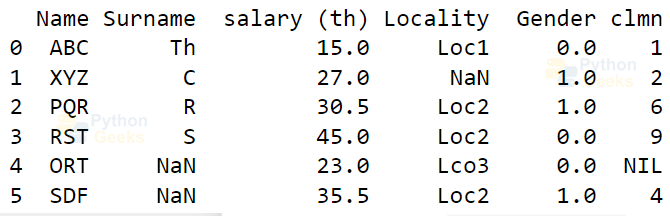
Now we will merge the data frame based on the Name column.
Example of merging the data frames:
print(pd.merge(dataFrame, df2, on='Name'))
Output:
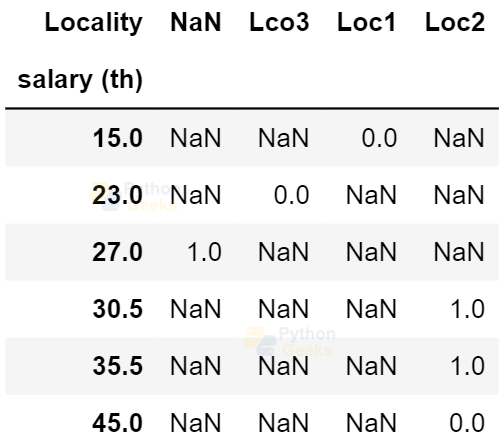
Pivoting Dataset
We can get the pivot table, where we can correlate columns.
Example of pivoting the data frames:
dataFrame.pivot(index='salary (th)',columns='Locality',values='Gender')
Output:
Removing Duplicates
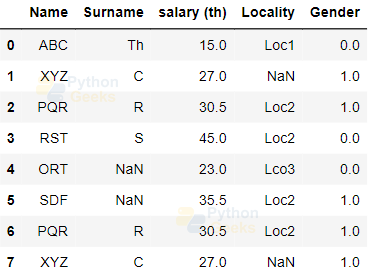
First, let us add some duplicate rows and do the operation to remove these duplicates.
Example of adding rows to the data frames:
dataFrame = dataFrame.append({'Name': 'PQR', 'Surname': 'R', 'salary (th)': 30.5,'Locality':'Loc2','Gender':1.0}, ignore_index = True)

dataFrame = dataFrame.append({'Name': 'XYZ', 'Surname': 'C', 'salary (th)': 27.0,'Gender':1.0}, ignore_index = True)

dataFrame
Output:
Example of removing the duplicates from the data frames:
dataFrame.drop_duplicates()
Output:
We can also remove duplicates based on a column. Let us remove duplicates based on the column Locality.
Example of removing the duplicates from the data frames:
df_new=dataFrame[~dataFrame.duplicated('Locality')]
df_new
Output:
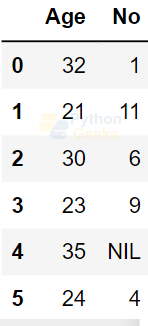
Concatenating the Dataframes
Let us create another data frame and then we will contaminate the two data frames.
Example of creating a data frame:
df = pd.DataFrame(
    {'Age': [32,21,30,23,35,24],
     'No': [1,11,6,9,'NIL',4]})
df
Output:
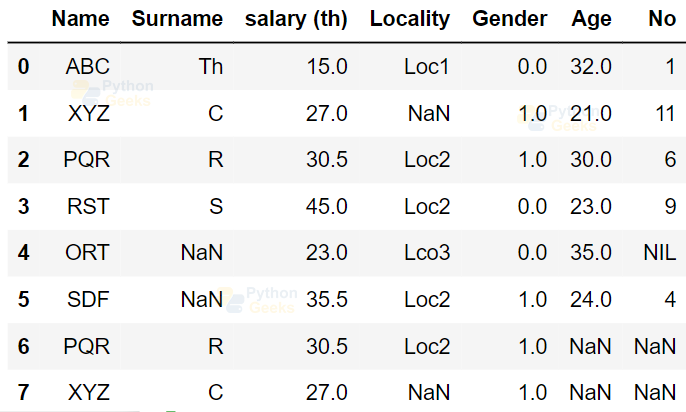
Example of removing the duplicates from the data frames:
pd.concat([dataFrame,df], axis=1)
Output:
Interview Questions
1. Write a program to replace the null values in a column having integer values by the mean of the integers in the column.
Ans. Below is the example:
import pandas as pd

data = {'Id':[1,2,3,4,5],
             'Name': ['A', 'B','C', 'D','E'],
             'Age': [34,23,'NaN',30,35],
     'Salary': [15,23,30.5,45,40.5]}


df = pd.DataFrame(data)
print("Original DataFrame:\n")
print(df)

count = avg = 0
for x in df['Age']:
    if str(x).isnumeric():
        count += 1
        avg += x
avg /= count

# Replace missing values
df = df.replace(to_replace="NaN",
                value=avg)

print("\nModified DataFrame:\n")
print(df)
Output:
Id Name Age Salary
0 1 A 34 15.0
1 2 B 23 23.0
2 3 C NaN 30.5
3 4 D 30 45.0
4 5 E 35 40.5
Modified DataFrame:
Id Name Age Salary
0 1 A 34.0 15.0
1 2 B 23.0 23.0
2 3 C 30.5 30.5
3 4 D 30.0 45.0
4 5 E 35.0 40.5
2. Write a program to get the rows that have the Salary values in the range 20 and 40.
Ans. Below is the example:
df_new= df[(df['Salary'] >= 20) & (df['Salary'] <= 40)]
print(df_new)
Output:
1 2 B 23.0 23.0
2 3 C 30.5 30.5
3. Write a program to merge two data frames based on the column named.
Ans. Let’s create another data frame named df2 with a common column Id and then merge them.
Example of :
new_data = {'Id':[1,2,3,4,5],'Location':['Loc1','Loc2','Loc3','Loc4','Loc5']}
df2 = pd.DataFrame(new_data)

print(pd.merge(df, df2, on='Id'))
Output:
0 1 A 34.0 15.0 Loc1
1 2 B 23.0 23.0 Loc2
2 3 C 30.5 30.5 Loc3
3 4 D 30.0 45.0 Loc4
4 5 E 35.0 40.5 Loc5
4. Write a program to remove the duplicates from the column Id.
Ans. Let us have a duplicate value in the column and then we can remove it.
Example of :
df = df.append({'Id':3,'Name': 'C', 'Age': 30.5, 'Salary': 30}, ignore_index = True)
print("Duplicated DataFrame:\n")
print(df)

df=df[~df.duplicated('Id')]
print("\nDataFrame without duplicates:\n")
print(df)
Output:
Id Name Age Salary
0 1 A 34.0 15.0
1 2 B 23.0 23.0
2 3 C 30.5 30.5
3 4 D 30.0 45.0
4 5 E 35.0 40.5
5 3 C 30.5 30.0
DataFrame without duplicates:
Id Name Age Salary
0 1 A 34.0 15.0
1 2 B 23.0 23.0
2 3 C 30.5 30.5
3 4 D 30.0 45.0
4 5 E 35.0 40.5
5. Write a program to concatenate two data frames having the same columns vertically.
Ans. Below is the example:
data_new = {'Id':[6,7,8],
                    'Name': ['F', 'G','H'],
            'Age': [45,34,30],
            'Salary': [34,60,55]}

df2 = pd.DataFrame(data_new)
print("New DataFrame:\n")
print(df2)

print("\nConcatenated DataFrame:\n")
print(pd.concat([df,df2], axis=0, ignore_index = True))
Output:
Id Name Age Salary
0 6 F 45 34
1 7 G 34 60
2 8 H 30 55
Concatenated DataFrame:
Id Name Age Salary
0 1 A 34.0 15.0
1 2 B 23.0 23.0
2 3 C 30.5 30.5
3 4 D 30.0 45.0
4 5 E 35.0 40.5
5 6 F 45.0 34.0
6 7 G 34.0 60.0
7 8 H 30.0 55.0
Conclusion
Finally, we are at the end of the article. We have discussed different operations we can perform on the data using the Pandas module for the wrangling purpose. Hope all the concepts discussed are understood by you. Happy learning!
