Develop Data Visualization Interfaces in Python With Dash
From learning to earning – Courses that prepare you for job - Enroll now
Welcome, readers! In this article, we’ll explore a powerful Python framework called Dash that allows you to build interactive and customizable data visualization interfaces. Whether you’re a data scientist, developer, or anyone interested in creating visually appealing and user-friendly dashboards, Dash provides an intuitive and efficient solution. Let’s dive into the world of data visualization with Dash and see how it can empower your projects!
Understanding Dash: A Definition
Dash is a freely available Python framework specifically developed for constructing interactive web interfaces for data visualization purposes. It combines the flexibility of Python with the versatility of web technologies, allowing you to create interactive and responsive dashboards, reports, and applications.
Key points about Dash:
- Dash provides a high-level interface for creating web applications using Python, HTML, CSS, and JavaScript.
- It offers a wide range of pre-built components and an extensive library of data visualization tools, making it easy to create interactive plots, charts, and graphs.
- Dash follows a reactive programming paradigm, which means the user interface automatically updates based on user interactions or changes in the underlying data.
- With Dash, you can create fully customizable and visually appealing dashboards that can be deployed as standalone apps or integrated into existing web applications.
Getting Started with Dash
To start developing data visualization interfaces with Dash, follow these steps:
Install the necessary libraries:
To use Dash, you need to install the Dash library using pip. Once installed, you can import the necessary modules and libraries to start building your visualization interface. Commonly used modules include dash, dash_core_components, and dash_html_components. Setting up the required dependencies and configuring your development environment is the first step in working with Dash.
pip install dash
Import the required modules:
import dash
import dash_core_components as dcc
import dash_html_components as html
Interactive Components:
Dash provides a wide range of interactive components that allow users to interact with the data visualizations. These components include sliders, dropdowns, checkboxes, buttons, and more. By incorporating these interactive elements into your interface, users can manipulate the displayed data, apply filters, and trigger updates to the visualization. Dash allows you to define callbacks that handle these interactions and update the visualizations accordingly.
Create a Dash application:
app = dash.Dash(__name__)
Define the layout of your application using HTML and Dash components:
Dash uses a component-based approach to construct web interfaces. You define the layout of your dashboard by combining HTML-like tags and Dash-specific components. The layout determines the structure and arrangement of the visual elements in your interface. You can organize components in rows, columns, grids, or nested structures to create a visually appealing and intuitive layout.
import dash
import dash_html_components as html
app = dash.Dash(__name__)
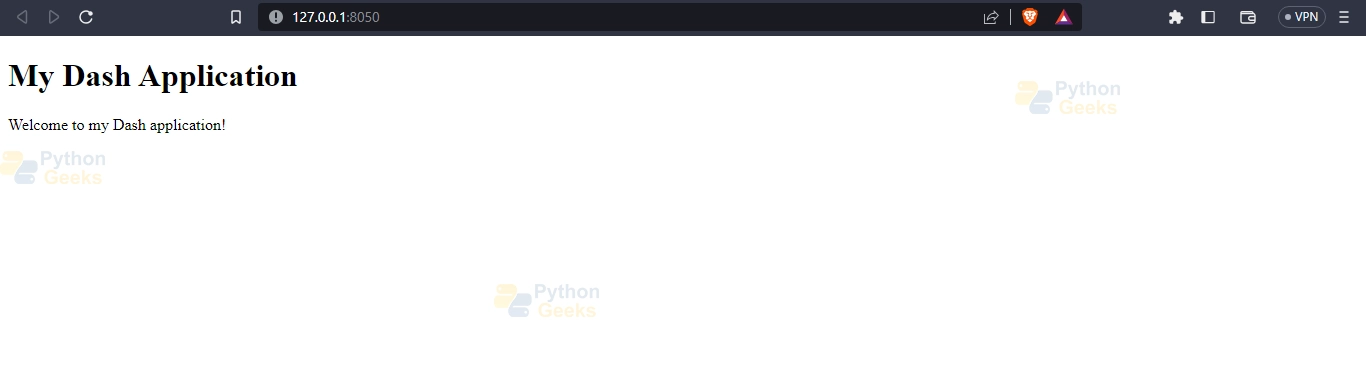
app.layout = html.Div(
children=[
html.H1("My Dash Application"),
html.P("Welcome to my Dash application!")
]
)
if __name__ == "__main__":
app.run_server(debug=True)
Output:
Data Visualization with Plotly:
Dash integrates seamlessly with Plotly, a powerful Python library for creating interactive visualizations. Plotly offers a wide variety of chart types, including line charts, bar charts, scatter plots, heat maps, and more. With Dash, you can incorporate Plotly charts into your application to display and visualize your data. Plotly’s extensive customization options enable you to create visually appealing and informative visualizations tailored to your specific needs.
Callbacks and Interactivity:
Dash allows you to make your application interactive by defining callbacks. Callbacks are Python functions that are triggered by user actions or input changes and update the displayed content accordingly.
Here’s an example of a callback that updates a graph based on a dropdown selection:
import dash
import dash_core_components as dcc
import dash_html_components as html
from dash.dependencies import Input, Output

app = dash.Dash(__name__)

app.layout = html.Div(
    children=[
        html.H1("My Dash Application"),
        dcc.Dropdown(
            id="my-dropdown",
            options=[
                {"label": "Option 1", "value": "option1"},
                {"label": "Option 2", "value": "option2"},
                {"label": "Option 3", "value": "option3"}
            ],
            value="option1"
        ),
        dcc.Graph(id="my-graph")
    ]
)

@app.callback(
    Output("my-graph", "figure"),
    [Input("my-dropdown", "value")]
)
def update_graph(selected_option):
    # Update the graph based on the selected dropdown option
    # Perform data processing and return a Plotly figure object
    # ...
    return figure

if __name__ == "__main__":
    app.run_server(debug=True)
Output:
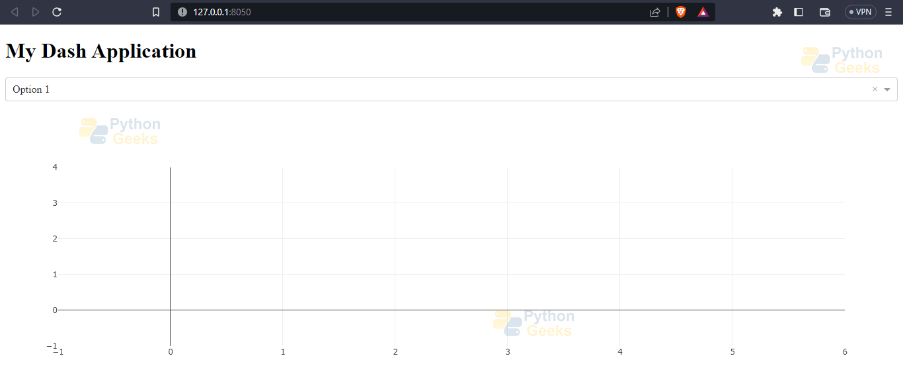
In this example, we create a dropdown component and a graph component. The callback function update_graph is triggered whenever the value of the dropdown changes. Inside the callback, you can update the graph based on the selected option and return a Plotly figure object to update the graph component.
Interactive Components and Visualizations:
Dash provides various interactive components and visualization options through the dash_core_components and plotly libraries. You can use components like sliders, checkboxes, buttons, and input fields to capture user input and create interactive elements in your application. Additionally, Plotly offers a wide range of chart types and customization options to create visually appealing and informative visualizations.
Deployment and Sharing:
Once you have built your Dash application, you can deploy it to various platforms to make it accessible to others. Dash applications can be deployed locally or on cloud platforms. Dash provides options for sharing your application with others, allowing them to interact with and explore the visualizations you have created. You can customize the sharing settings and control the level of access for different users.
Conclusion
In this article, we explored the power of Dash, a Python framework for developing data visualization interfaces. We defined Dash and highlighted its key features and advantages for creating interactive dashboards. By following the steps mentioned, you can start building your own data visualization interfaces using Dash and unleash the potential of your data.
Dash opens up endless possibilities for creating stunning and user-friendly visualizations, making it an essential tool for data scientists, developers, and anyone working with data. So, dive into Dash, experiment with different components, and bring your data to life through interactive visualizations.
Happy coding and happy visualizing!
