Pandas groupby() Method – Examples, Uses and Tools
FREE Online Courses: Enroll Now, Thank us Later!
Data analysis deals with a broad spectrum of data organization, so data analysis and its efficiency count very much. Approaching Pandas Group, an able and delicate tool in scrutinizing through datasets intricacies, could not be done without encountering ‘Groupby’. Grasping the pattern of data is the heart of data grouping. The attributes are grouped together in a way that is how we discover important information from the raw data.
Data analysis is the terminus where pandas groupby turned out to be one of the powerful allies. Whether you are a beginner aiming to understand data science or an advanced analyst looking for more options, pandas groupby easily fits your requirement. This means that the compounds either added or released from the clothing materials can have both beneficial and harmful effects on the people wearing them, as well as on the environment.
Pandas Groupby helps analysts and Data Scientists to split the large datasets into parts that can be managed and then it is easy to focus and apply more targeted analysis. The ability of this feature to work with a multifarious amount of data structures is also an attribute which renders it powerful enough to handle plain numerical values array, as well as complex, multi-dimensional datasets. Thus, by habit, the tool becomes the first choice for answering the following questions: – What do the patterns of the data look like? – How are the data trending? – Is there any anomaly present in the data?
In the world of data, there is usually complexity created by various datasets with a tremendous number of different elements. Pandas Groupby is a consolidated mechanism that literally facilitates categorization of the user-defined data structure to enhance processing speed. This will not only make the analysis effective but also increase the possibilities for sophisticated findings which were not previously displayed.
Beginning the chapter that we are venturing into the simplicity of Pandas Groupby, we shall look through the meaning of the concepts, the syntax and the applications of the method. The guide is for those who are either beginners trying to get a grasp or researchers with experience who aim to enlarge their toolset. You are going to learn how to use Panda GroupBy to its full potential.
What is Pandas groupby?
When you use the Pandas library for Python, you may use the effective Pandas Groupby feature to make it easier to break up, practice, and combine data. The ‘groupby’ function’s primary reason is to separate a dataset into organizations primarily based on a specific issue, like specific values in a certain column. Once grouped, you may do different things on these subsets separately, which makes it a crucial device for fast reading and changing facts.
Basic Definition of Pandas groupby():
The ‘groupby’ characteristic works on a DataFrame and groups information by using certain criteria, which can be generally one or extra columns. A GroupBy item is made, which is a beneficial middle-ground that stores information about how the records are grouped. Once the statistics are grouped, you can use aggregate capabilities, alterations, or different operations on each group one after the other. This lets you do a better and centered evaluation.
Why Pandas Groupby Is Useful:
1. Aggregation: When you organize information, you may use features like sum, imply, matter, and so forth to feature up the facts in every group. This is mainly useful for buying a short take a look at the records for each institution.
2. Transformation: The GroupBy object lets you change the facts in every group one after the other via transformations. This enables when you want to make values the same or exclusive based on standards which are specific to a set.
3. Filtration: You can exclude or keep certain subsets of facts by means of filtering corporations based on sure situations. This enables you recognition at the components of the dataset which are important.
4. Combining Operations: Groupby works properly with other Pandas operations, like merging datasets or making pivot tables, so that you can do extra complicated and advanced analyses.
Simple Example:
Let’s have a look at a simple example: making up a hard and fast statistics of your earnings. We want to organize the information via “Region” and locate the entire of all of the sales in each region.
import pandas as pd

# Sample sales data
data = {'Region': ['East', 'West', 'North', 'East', 'West'],
        'Sales': [100, 150, 200, 120, 180]}

df = pd.DataFrame(data)

# Grouping by 'Region' and calculating total sales
grouped_data = df.groupby('Region')['Sales'].sum()

print(grouped_data)
Output :
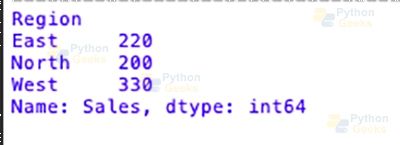
The groupby(Region) attribute is used to kind the data by the Region column in this situation. Then, we use “sum()” to discover the whole sum of money crafted from all the sales in all of the locations. Because of this, a Pandas Series shows the entire income for each vicinity.
Syntax and Parameters of Pandas Groupby:
The groupby feature in Pandas can be used to position statistics into businesses primarily based on some exclusive criteria. Let’s study the syntax and key parameters one by one:
DataFrame.groupby(by=None, axis=0, level=None, as_index=True, sort=True, group_keys=True, squeeze=<no_default>, observed=False, **kwargs)
1. By:
This parameter tells this system a way to institution matters collectively. It may be a Series, a column name, or a list of column names.
2. Axis:
Figures out whether or not the grouping is performed along rows (“axis=zero”) or columns (“axis=1”).
‘zero’ (the default) corporations by row, and ‘1’ organizations by column.
3. Level:
The stage or degrees to apply for grouping hierarchical index (MultiIndex) statistics are set through this parameter.
‘df.Groupby(stage=’Date’)’ or ‘df.Groupby(stage=[0, 1])’ are examples.
4. As_index:
If this belongs to True (the default), the grouped labels are brought to the index. If that is False, the index will now not be modified.
‘df.Groupby(‘Category’, as_index=False)’ is an instance.
5. Sort:
This function assesses if the groups need to be taken care of by way of the group keys. If you set it to False, it’ll paint higher with large datasets.
‘df.Groupby(‘Category’, kind=False)’ is an example.
6. Group_keys:
If this belongings is set to True (the default), the institution keys are delivered to the index of the DataFrame this is created.
‘df.Groupby(‘Category’, group_keys=False)’ is an instance.
7. Squeeze:
If Squeeze=True’ and the grouped information ends up in a DataFrame with only one column, the result could be returned as a Series.
‘df.Groupby(‘Category’, squeeze=True)’ is an instance.
These parameters provide you with excellent-grained manipulate over the grouping procedure, so you can make it fit the needs of your evaluation. To get the maximum out of the Pandas Groupby capability, you need to understand these parameters.
Grouping Strategies
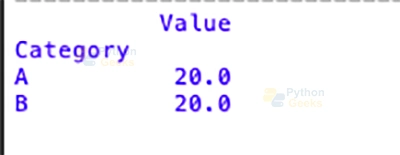
1. Single Column Grouping:
Organizing records into corporations primarily based on a single column.
import pandas as pd

# Sample data
data = {'Category': ['A', 'B', 'A', 'B', 'A'],
        'Value': [10, 15, 20, 25, 30]}

df = pd.DataFrame(data)

# Grouping by 'Category' and calculating mean
grouped_single_column = df.groupby('Category').mean()
print(grouped_single_column)
Output:
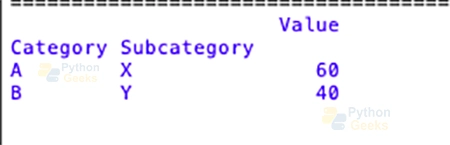
2. Multiple Columns Grouping:
Combining statistics together primarily based on multiple columns.
import pandas as pd

# Sample data
data = {'Category': ['A', 'B', 'A', 'B', 'A'],
        'Subcategory': ['X', 'Y', 'X', 'Y', 'X'],
        'Value': [10, 15, 20, 25, 30]}

df = pd.DataFrame(data)

# Grouping by both 'Category' and 'Subcategory' and calculating sum
grouped_multiple_columns = df.groupby(['Category', 'Subcategory']).sum()
print(grouped_multiple_columns)
Output:
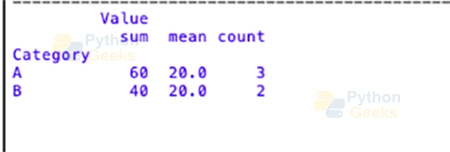
3. Aggregation with Single Column Grouping:
Using sum, imply, and be counted functions on records that have been grouped.
import pandas as pd
# Sample data
data = {'Category': ['A', 'B', 'A', 'B', 'A'],
'Value': [10, 15, 20, 25, 30]}
df = pd.DataFrame(data)
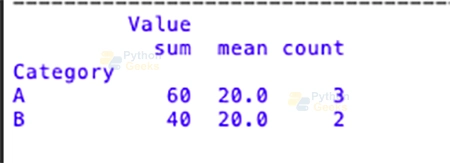
# Grouping by 'Category' and calculating sum, mean, and count
grouped_aggregation = df.groupby('Category').agg({'Value': ['sum', 'mean', 'count']})
print(grouped_aggregation)
Output:
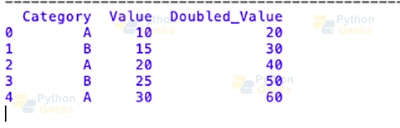
4. Transformation with Grouping:
Using the “transform” method to do operations on organizations.
import pandas as pd

# Sample data
data = {'Category': ['A', 'B', 'A', 'B', 'A'],
        'Value': [10, 15, 20, 25, 30]}
df = pd.DataFrame(data)

# Grouping by 'Category' and applying a transformation to double the values
df['Doubled_Value'] = df.groupby('Category')['Value'].transform(lambda x: x * 2)
print(df)
Output:
5. Filtering with Grouping:
By the usage of the “clear out” method to pass over companies that meet sure standards.
import pandas as pd

# Sample data
data = {'Category': ['A', 'B', 'A', 'B', 'A'],
        'Value': [10, 15, 20, 25, 30]}

df = pd.DataFrame(data)

# Filtering out groups with mean value less than 25
filtered_groups = df.groupby('Category').filter(lambda x: x['Value'].mean() >= 25)
print(filtered_groups)
Output:
These examples show some extraordinary approaches to organization records, such as aggregation, transformation, filtering, and single and a couple of column grouping. By gambling around with these thoughts, you’ll build a strong foundation for the usage of Pandas Groupby for your statistics evaluation tasks.
Common Aggregation Functions
1. Summarizing Data with Aggregation:
import pandas as pd

# Sample data
data = {'Category': ['A', 'B', 'A', 'B', 'A'],
        'Value': [10, 15, 20, 25, 30]}

df = pd.DataFrame(data)

# Grouping by 'Category' and calculating sum, mean, and count
aggregated_data = df.groupby('Category').agg({'Value': ['sum', 'mean', 'count']})
print(aggregated_data)
Output :
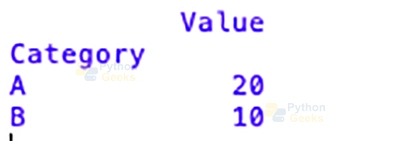
2. Custom Aggregation Functions:
Using the ‘agg’ technique to use custom aggregation capabilities.
import pandas as pd

# Sample data
data = {'Category': ['A', 'B', 'A', 'B', 'A'],
        'Value': [10, 15, 20, 25, 30]}

df = pd.DataFrame(data)

# Defining a custom aggregation function
def custom_agg_function(x):
    return x.max() - x.min()

# Grouping by 'Category' and applying the custom aggregation function
custom_aggregation = df.groupby('Category').agg({'Value': custom_agg_function})
print(custom_aggregation)
Output :
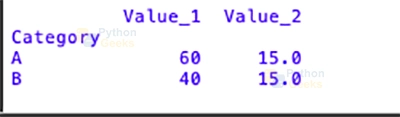
3. Multiple Aggregation Functions:
Using one of a kind columns with more than one aggregation characteristic.
import pandas as pd

# Sample data
data = {'Category': ['A', 'B', 'A', 'B', 'A'],
        'Value_1': [10, 15, 20, 25, 30],
        'Value_2': [5, 10, 15, 20, 25]}

df = pd.DataFrame(data)

# Grouping by 'Category' and calculating sum for 'Value_1' and mean for 'Value_2'
multiple_aggregation = df.groupby('Category').agg({'Value_1': 'sum', 'Value_2': 'mean'})
print(multiple_aggregation)
Output:
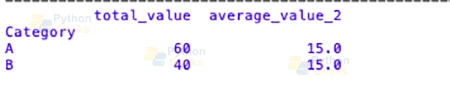
4. Named Aggregation with Pandas zero.25.0 (elective):
Named aggregation makes it less complicated to list more than one capability.
import pandas as pd

# Sample data
data = {'Category': ['A', 'B', 'A', 'B', 'A'],
        'Value_1': [10, 15, 20, 25, 30],
        'Value_2': [5, 10, 15, 20, 25]}

df = pd.DataFrame(data)

# Grouping by 'Category' and applying named aggregation
named_aggregation = df.groupby('Category').agg(
    total_value=('Value_1', 'sum'),
    average_value_2=('Value_2', 'mean')
)
print(named_aggregation)
Output:
These examples display how to use trendy aggregation functions, custom aggregation capabilities, and grouped data with more than one aggregation capability. If you study and attempt these strategies, you may be capable of using Pandas Groupby to get beneficial facts out of your datasets.
Transformation and Filtration
Transformation:
Using the transform approach to do operations in groups.
import pandas as pd

# Sample data
data = {'Category': ['A', 'B', 'A', 'B', 'A'],
        'Value': [10, 15, 20, 25, 30]}
df = pd.DataFrame(data)

# Define a custom transformation function
def normalize_group(group):
    mean = group.mean()
    std = group.std()
    return (group - mean) / std

# Apply the transformation using transform
df['Normalized_Value'] = df.groupby('Category')['Value'].transform(normalize_group)
print(df)
Output:
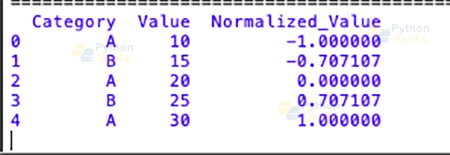
This feature is added to the table by the utilization of this technique in the “Value” column for each “strategies” category. This results with a new member to the column called “Normalized_Value.”
Filtration:
Explanation:
You can leave out corporations primarily based on certain situations the usage of the “filter” method in Pandas Groupby. It works sincerely properly whilst you need to cognizance of certain components of your statistics or cast off those that don’t in shape the rest.
Example:
import pandas as pd
# Sample data
data = {'Category': ['A', 'B', 'A', 'B', 'A'],
'Value': [10, 15, 20, 25, 30]}
df = pd.DataFrame(data)
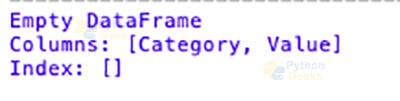
# Grouping by 'Category' and filtering out groups with total 'Value' less than 40
filtered_groups = df.groupby('Category').filter(lambda x: x['Value'].sum() >= 40)
print(filtered_groups)
Output:
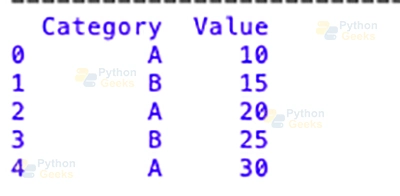
The “clear out” technique is used to omit businesses where the sum of the “Value” values is much less than forty. The resulting DataFrame best has the corporations that meet the situation that turned into a given.
The ‘transform’ and ‘clear out’ techniques in Pandas Groupby may be utilized in a variety of one of a kind methods to do operations on companies and exclude businesses based on sure standards. You could be able to trade and examine grouped statistics higher after playing around with those functions.
Summary
Essentially, Pandas Groupby function is a powerful and handy tool for any data professional who aims to get deep into the datasets and uncover the information inside. Your data analysis method is not limited to your level of experience, as long as you can figure out grouping, summing up, transforming, and filtering or sifting data. You can now do detailed and targeted analysis.
By this end-to-end guide, we’ve investigated the basics of grouping and accomplished not only the basics but also the advanced concepts, syntax, and strategies of leveraging Pandas Groupby. It is not only a small single column group, you now get the ability to transform and filter the data as well, unlocking the full power.
By the process of your data analysis, be aware that Groupby in Pandas is not at all just a feature but it is an entry to a world of complex data set evaluation in which you are able to dig out the hidden statistics and patterns. Extend your repertoire by incorporating these techniques and test the results of a wide range of scenarios to improve your capacity to perform data manipulation in the Pandas Groupby style. The opportunity to harness this tool skillfully may result in your achievements of more sophisticated perception and analysis to assist you in your future data driven activities.