Python Pandas Series
Get Ready for Your Dream Job: Click, Learn, Succeed, Start Now!
In the large field of analysing and transforming data, the Pandas Series stands out as a tool that is both easy to use and flexible. So, just what’s a Pandas Series?
In many ways, a Pandas Series is like an effective one-dimensional labelled array. This is the core of the Pandas library, an effective tool for working with and studying statistics in Python. This collection could be very vital because it can easily handle specialised types of data, making it the primary choice for a wide range of responsibilities in the field of data technology.
Please think of the Pandas Series as a properly organised column in a spreadsheet, where each object has its own label or index. This simple yet effective shape makes it easy to store, discover, and modify facts, which is crucial for any records-driven venture.
Let’s begin this journey via the complexities of Pandas Series. We’ll find out what it can do, how it can be used, and how this simple statistical shape is critical to solving the mysteries that lie within our datasets. No matter how experienced you are as an information analyst or how new you are to the records and information sector, Pandas Series is the key to getting the maximum out of your information. Let’s get to the heart of record preservation and see what exceptional features Pandas Series offers.
What is a Pandas Series?
At its core, a Pandas Series is a primary records shape that is a convenient way to represent a one-dimensional array of values. Let’s ruin this definition to understand what it means.
Labelled Array in One Dimension
One-Dimensional: A Series is a linear, one-row set of information, not an n-dimensional shape like a dataframe. It looks like a list or column in a spreadsheet, which makes it well-suited for obligations where information needs to be organised in a single line.
A Pandas Series already has a label or index for every object in the array. In the same manner that you may quickly locate an item in a nicely organised listing, this index makes it easy to discover information.
Different forms of information
One of the most interesting aspects of a Pandas Series is that it can handle a wide range of data types. Now remember: if you are running with strings, integers, floating-point numbers, or even complex devices, a Series will handle them all with grace. Because it is so flexible, it’s far from a must-have tool for statistical analysis, especially when datasets contain many variables.
To picture a Pandas Series, think about it as a single column in a spreadsheet. Each cell contains a collection of facts, and the label on every row makes it easy to find. The idea for manipulating green information and checking out the Pandas library comes from this form, which is easy and flexible. In the sections that follow, we’ll learn how to create, manage, and gain insights from Pandas Series so that we can use this one-dimensional powerhouse to its fullest.
Creating a Pandas Series
Now that we understand what a Pandas Series is, let’s dive into the practical aspect of making one. Pandas provides several techniques for generating a Series, and we’ll explore some uses of exceptional statistical types. Now that we recognise what a Pandas Series is, let’s dive into the practical aspect of making one. Pandas provides several techniques for generating a Series, and we’ll explore a few uses of unique data types.
1. Using Lists
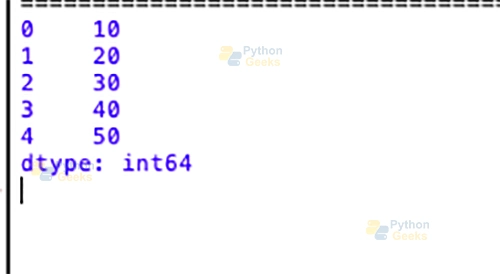
One of the simplest ways to create a Pandas Series is by passing a Python list. The index will be automatically assigned.
import pandas as pd

# Creating a Series from a list
my_list = [10, 20, 30, 40, 50]
series_from_list = pd.Series(my_list)

print(series_from_list)
Output:

2. Using NumPy Arrays
If you’re working with NumPy arrays, creating a Pandas Series is a breeze. The index is generated automatically.
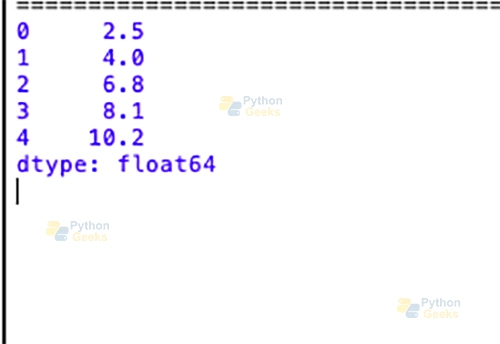
import pandas as pd
  import numpy as np

  # Creating a Series from a NumPy array
  my_array = np.array([2.5, 4.0, 6.8, 8.1, 10.2])
  series_from_array = pd.Series(my_array)

  print(series_from_array)
Output:
3. Using Dictionaries
When creating a Series from a dictionary, the keys become the index and the values become the data.
import pandas as pd
# Creating a Series from a dictionary
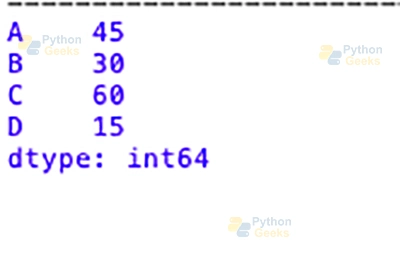
my_dict = {'A': 45, 'B': 30, 'C': 60, 'D': 15}
series_from_dict = pd.Series(my_dict)
print(series_from_dict)
Output:
These examples showcase the versatility of creating Pandas Series. Whether you start with a list, a NumPy array, or a dictionary, Pandas makes it seamless to convert your data into a structured, labelled Series ready for analysis. In the upcoming sections, we’ll explore operations, manipulations, and the true power of Pandas Series in your data-handling toolkit.
Fundamental Operations with Pandas Series
1. Accessing Elements using Indexing
Pandas Series allows easy access to its elements using indexing. You can use either the numerical position or the labelled index.
import pandas as pd

   # Creating a Series
   my_series = pd.Series([10, 20, 30, 40, 50], index=['A', 'B', 'C', 'D', 'E'])

   # Accessing elements by numerical position
   print(my_series[2])

   # Accessing elements by labeled index
   print(my_series['D'])
2. Basic Operations
Pandas Series supports a variety of basic operations, such as addition, subtraction, multiplication, and division. These operations are performed element-wise.
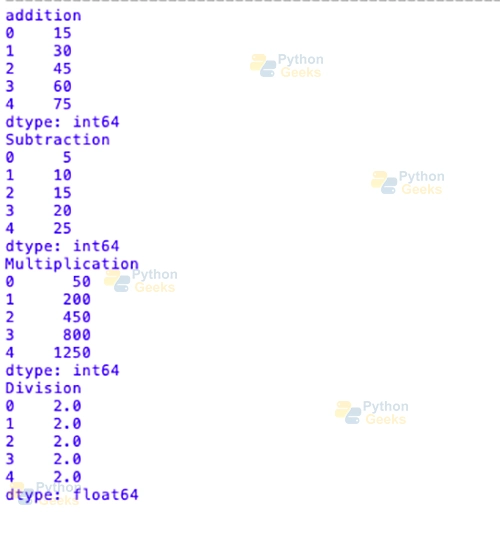
import pandas as pd

   # Creating two Series
   series_1 = pd.Series([10, 20, 30, 40, 50])
   series_2 = pd.Series([5, 10, 15, 20, 25])

   # Addition
   result_addition = series_1 + series_2
   print(result_addition)

   # Subtraction
   result_subtraction = series_1 - series_2
   print(result_subtraction)


   # Multiplication
   result_multiplication = series_1 * series_2
   print(result_multiplication)


   # Division
   result_division = series_1 / series_2
   print(result_division)
Output:
3. Handling Missing Data (NaN)
Pandas Series gracefully handles lacking or undefined data using NaN (Not a Number).
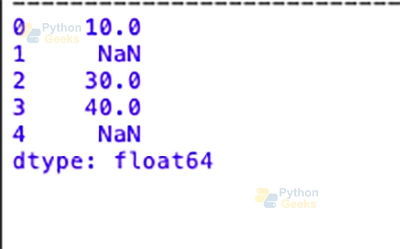
import pandas as pd

  # Creating a Series with missing data
  my_series = pd.Series([10, None, 30, 40, None])

  print(my_series)
Output:
This flexibility is beneficial in scenarios where datasets may contain areas or undefined values, enabling continuous evaluation without errors. In the following sections, we’ll dive deeper into the capabilities of Pandas Series, exploring its key attributes, techniques, and advanced operations.
Key Attributes and Methods
1. Attributes
Size: The size of an attribute returns the number of elements in the Pandas Series.
import pandas as pd

# Creating a Series
my_series = pd.Series([10, 20, 30, 40, 50])

# Getting the size of the Series
print(my_series.size)
Shape: The shape attribute returns a tuple representing the dimensions of the Series (in this case, it’s a one-dimensional structure).
import pandas as pd

  # Creating a Series
  my_series = pd.Series([10, 20, 30, 40, 50])

  # Getting the shape of the Series
  print(my_series.shape)
Values: The values attribute returns the actual data as a NumPy array.
import pandas as pd

    # Creating a Series
    my_series = pd.Series([10, 20, 30, 40, 50])

    # Getting the values of the Series as a NumPy array
    print(my_series.values)
2. Methods
head():
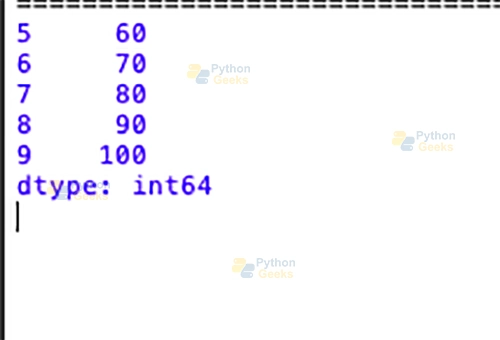
The head() method is effectively used to display the first few elements of the Series. By default, it only shows the first five elements of the series.
import pandas as pd

   # Creating a Series
   my_series = pd.Series([10, 20, 30, 40, 50, 60, 70, 80, 90, 100])

   # Displaying the first five elements of the Series
   print(my_series.head())
Output:
tail(): The tail() method is specifically used to display the last few elements of the Series. By default, it shows the last five elements of the series.
import pandas as pd

    # Creating a Series
    my_series = pd.Series([10, 20, 30, 40, 50, 60, 70, 80, 90, 100])

    # Displaying the last five elements of the Series
    print(my_series.tail())
Output:
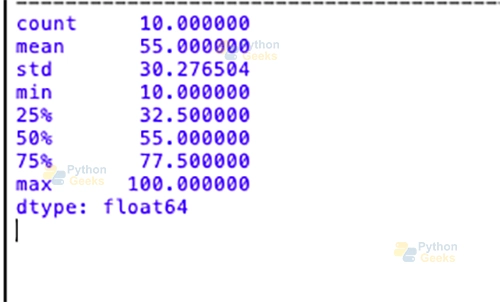
describe(): The describe() method provides statistical information about the data, which includes count, mean, std (standard deviation), min, and various percentiles.
import pandas as pd

 # Creating a Series
 my_series = pd.Series([10, 20, 30, 40, 50, 60, 70, 80, 90, 100])

 # Displaying summary statistics of the Series
 print(my_series.describe())
Output:
These attributes and methods provide valuable insights into the characteristics of a Pandas Series, helping in the exploration and understanding of the underlying records.
Handling Missing Data
Dealing with a lack of statistics is not an unusual task in fact-finding. Pandas Series provides methods such as dropna() and fillna() to handle missing values efficiently.
1. Dropna()
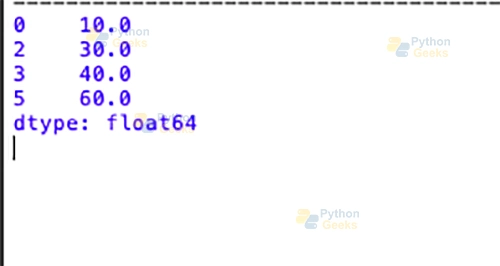
The dropna() method removes missing values from a Pandas Series. It returns a brand new Series with missing values unnoticed.
import pandas as pd

# Creating a Series with missing data
my_series = pd.Series([10, None, 30, 40, None, 60])

# Dropping missing values
cleaned_series = my_series.dropna()

print(cleaned_series)
Output:
2. fillna()
The fillna() method allows you to fill in missing values with a specified value or a computed value, such as the mean or median.
import pandas as pd

# Creating a Series with missing data
my_series = pd.Series([10, None, 30, 40, None, 60])

# Filling missing values with a specific value (e.g., 0)
filled_series = my_series.fillna(0)

print(filled_series)
You can also fill out the missing values with the mean or median of the Series using “.mean()”.
import pandas as pd

   # Creating a Series with missing data
   my_series = pd.Series([10, None, 30, 40, None, 60])

   # Filling missing values with the mean of the Series
   mean_filled_series = my_series.fillna(my_series.mean())

   print(mean_filled_series)
These methods provide flexibility in handling missing information in a manner that suits the specific necessities of your analysis. Whether you choose to drop missing values or fill them with specific values or computed values, Pandas Series provides tools to make informed decisions about how to handle gaps in your data.
Summary
The Pandas Series stands out as a valuable and flexible tool in statistical analysis. It has become clear how smooth and powerful this one-dimensional categorised array is as we went through its basics, creation, operations, and handling missing information.
Pandas Series can easily store data from lists, arrays, or dictionaries. Accessing factors, acting number one operations, and the use of attributes and techniques provide researchers a solid basis for looking into and know-how information.
With strategies like “dropna()” and “fillna(),” you could precisely cope with missing statistics. This adds another degree of class to the Pandas Series toolkit. Because it is so flexible, the Series can effortlessly fit into the complex structures of real-world datasets.
As you study more about data analysis, remember that Pandas Series isn’t just a way to organise data; it is also a key that unlocks the power hidden in your datasets. No matter how experienced you are as an analyst or how new you are to data analysis, mastering the Pandas Series is an excellent way to break down complex data and extract valuable insights. Laugh at coding!
